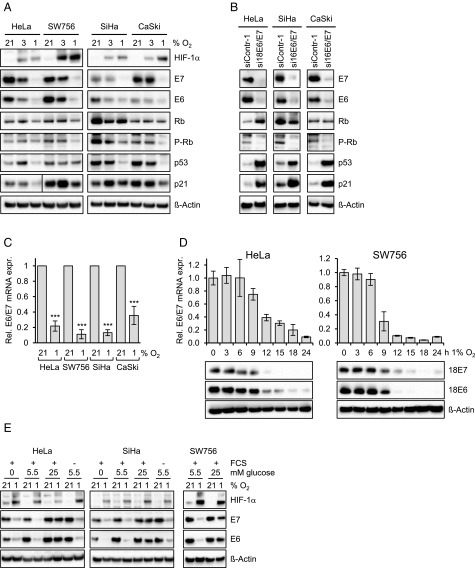
Fig. 1.
Repression of HPV E6/E7 oncogene expression under hypoxia. (A) HPV18-positive HeLa and SW756 cells and HPV16-positive SiHa and CaSki cells were cultured for 24 h at the indicated O2 concentrations. Shown are immunoblots of HIF-1α (hypoxia-linked marker), HPV16/18 E6, HPV16/18 E7, total Rb, phosphorylated Rb (P-Rb; Ser807/811), p53, and p21 protein expression. β-actin served as a loading control. (B) Normoxic cells were transfected with E6/E7-targeting siRNAs (si16E6/E7 or si18E6/E7) or control siRNA (siContr-1), and protein expression was analyzed by immunoblotting. (C) E6/E7 mRNA expression under normoxia (21% O2) or hypoxia (1% O2). Indicated are the mean E6/E7 transcript levels of at least five independent experiments measured by qRT-PCR after 24 h under hypoxia, for each cell line relative to the corresponding E6/E7 transcript levels under normoxia (set at 1.0). SDs are indicated. Asterisks above columns indicate statistically significant differences from normoxic cells (***P < 0.001). (D) Time course of hypoxia-linked E6/E7 repression. (Upper) Measurements of transcript levels by qRT-PCR. SDs of technical replicates are indicated (n = 3). (Lower) Accompanying analyses of protein levels by immunoblot. β-actin served as a loading control. (E) HPV-positive cancer cells were grown in medium containing 0 mM, 5.5 mM, or 25 mM glucose. The presence (+) or absence (−) of FCS in the medium is indicated. Cells were cultured under normoxia (21% O2) or hypoxia (1% O2). Shown are immunoblots of HPV16/18 E6, HPV16/18 E7, and HIF-1α levels. β-actin served as a loading control.

