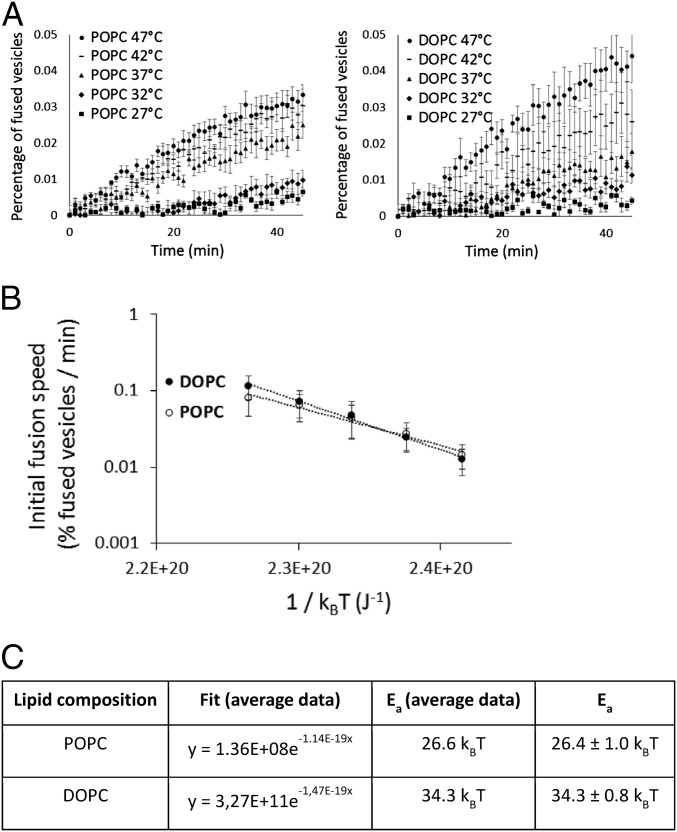
Fig. 2.
Estimate of the activation energy of POPC and DOPC vesicles fusion. (A) Fusion assays are performed at different temperatures (27–47 °C). The averages of six independent experiments are represented. The initial time (t = 0) is the time when the temperature was stabilized. The speed of fusion increases with temperature. Error bars are SEs on the mean. (B) Initial spontaneous fusion speeds are represented vs. the temperature (average of nine independent experiments for POPC and four for DOPC, error bars being SDs) and fitted by exponentials. Speeds of fusion were determined due to the initial slope of the curve representing the percentage of fused vesicles per minute (SI Text). (C) The exponential fits allow the determination of the activation energies for both reactions, here fusion. Independent fits were also performed for the different experiments, hence allowing the estimation of the error on the measurement (SE on the mean): 26.4 ± 1 kBT for POPC and 34.3 ± 0.8 kBT for DOPC.

