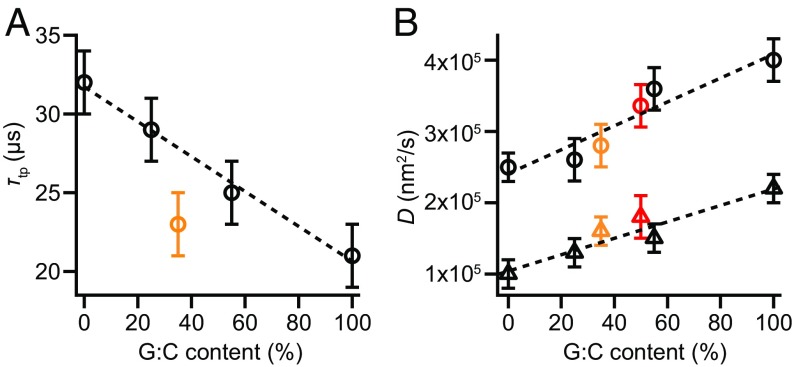
Fig. 5.
G:C dependence of τtp and D. (A) The average transition path time decreases linearly with increasing G:C content, with the exception of hairpin 20TS06/T4 (orange). (B) D increases linearly with G:C content for all hairpins, including hairpin 20TS06/T4 (orange), as determined from τtp (circles) and from fitting the exponential tail of PTP(t) (triangles). Error bars represent SEM, averaging over both folding and unfolding data for all molecules measured. Data points in red represent values for hairpin 30R50/T4 derived from measurements in ref. 25.

