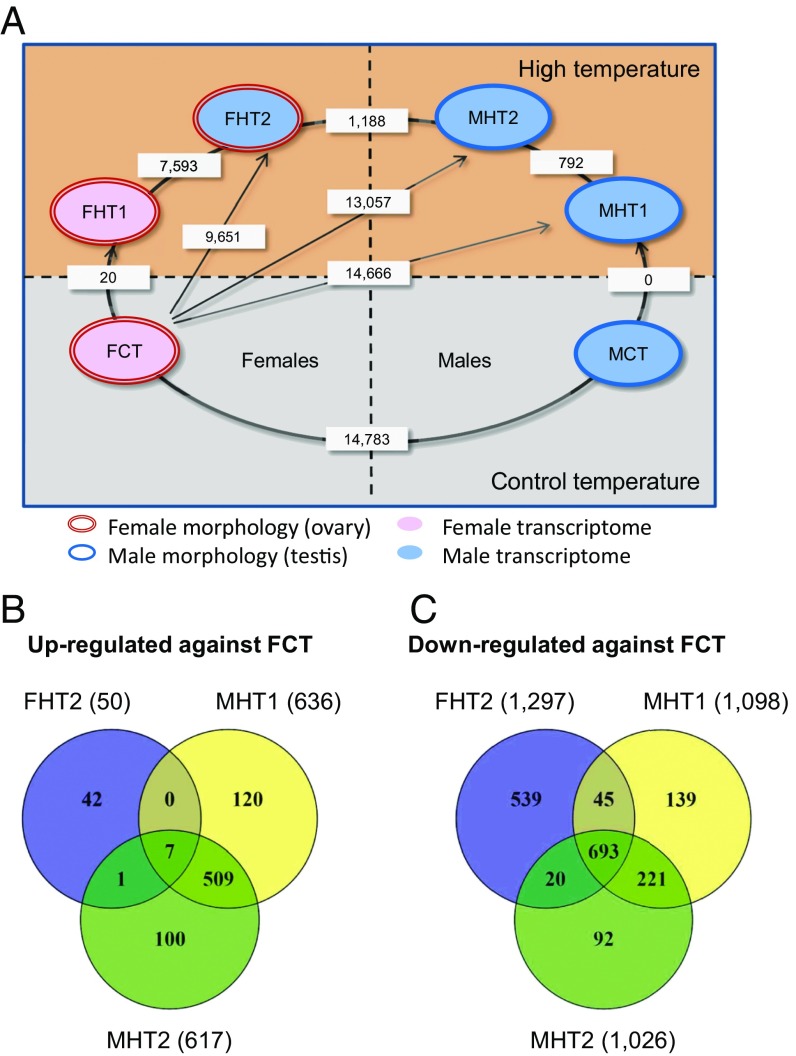
Fig. 2.
Gonadal transcriptome analysis shows differential expression between adults exposed to high temperature early in development. (A) Pairwise comparison of gonadal transcriptome profiles between control and heat-treated zebrafish grouped based on the results of principal component analysis. Only two different gonadal transcriptomes are observed at the control temperature (Lower), corresponding to control females (FCT) and control males (MCT). Exposure to high temperature resulted in two female transcriptomes, FHT1 and FHT2, as well as two male transcriptomes, MHT1 and MHT2 (Upper). The FHT2 and MHT2 transcription profiles differed not only from each other but also from those of control males (MCT) and females (FCT). Numbers of differentially expressed transcripts [fold change (FC), 1.5×; false discovery rate (FDR), P ≤ 0.01] between two phenotypes are indicated in the white rectangles. Sample sizes: FCT, n = 4; FHT1, n = 2; FHT2, n = 2; MCT, n = 10; MHT1, n = 8; MHT2, n = 2. (B and C) Venn diagram representation of biological process GO terms (B) up-regulated or (C) down-regulated in MHT1, MHT2, or FHT2 in pairwise comparison with FCT, as determined by microarray analysis (FC, 1.5×; FDR, P ≤ 0.01; see SI Appendix, Fig. S5 for similar Venn diagrams showing differentially expressed cellular component and molecular functions GO terms, as well as Dataset S4 for the complete list of all GO terms shown in this figure).

