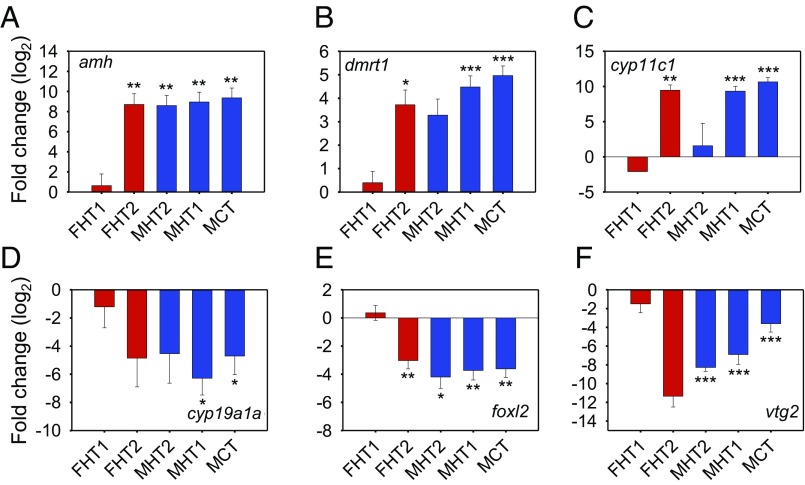
Fig. 3.
Gene expression profiles of six candidate genes with sex-associated function support the expression profiles of FHT2 females and MHT2 males. These data were obtained by qPCR analysis of gonadal expression levels at 90 dpf. The expression level of three genes with “promale” function (A–C) and three with “profemale” function (D–F) are shown relative to those of control females (FCT). Females are marked in red (FHT1 and FHT2) and males are marked in blue (MCT, MHT1, and MHT2). Average values from 2 to 10 individuals per group are shown with standard error of the mean (SEM). Values that show a statistically significant difference from FCT are labeled as: *P < 0.05, **P < 0.01, or ***P < 0.001; all Student’s t test.

