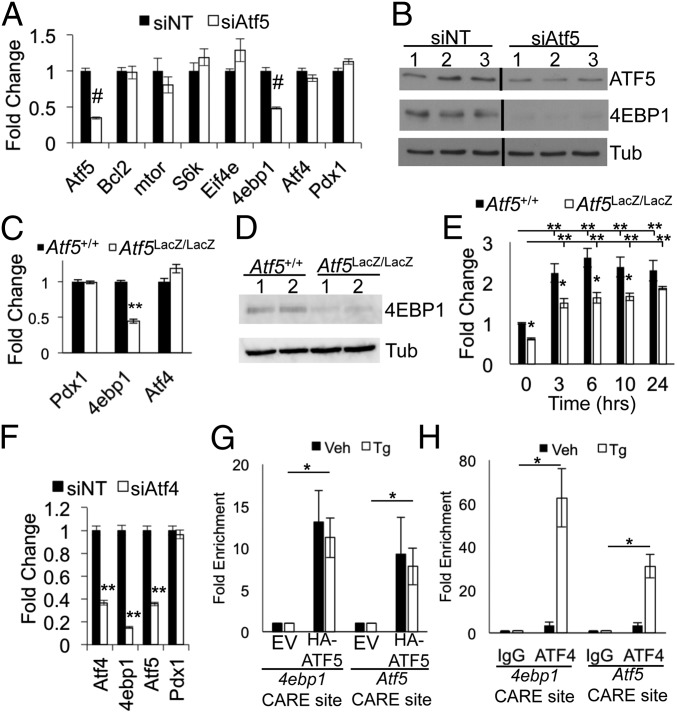
Fig. 5.
ATF5 regulates 4ebp1. (A and B) Min6 cells were nucleofected with siRNA targeting Atf5 (siAtf5) or with nontargeting control siRNA (siNT) and were harvested 96 h later for RNA (A) and protein (B). Lanes were run on same gel but were noncontiguous. qPCR results are shown for Atf5, mTor, S6k, Eif4e, 4ebp1, Atf4, and Pdx1. n = 6. (C and D) Islets isolated from Atf5+/+ and Atf5LacZ/LacZ mice were harvested for RNA (C) and protein (D). qPCR results are shown for Pdx1, 4ebp1, and Atf4. (n = 5) (E) Islets isolated from Atf5+/+ and Atf5LacZ/LacZ mice were cultured, treated with Tg (1 μM) for the denoted times and then were harvested for RNA. qPCR results are shown for 4ebp1. n = 5. (F) Min6 cells were nucleofected with siRNA targeting Atf4 or with nontargeting control siRNA and were harvested for RNA. qPCR results are shown for ATF4, 4ebp1, Atf5, and Pdx1. n = 3. (G and H) Min6 cells were infected with lentivirus expressing C-terminal HA-tagged ATF5 or empty vector control. ChIP PCR was performed on chromatin isolated from the cells expressing HA-ATF5 (G) and from wild-type Min6 cells (H), with or without treatment with Tg (1 μM) for 6 h using anti-HA, anti-ATF4, or anti-IgG. qPCR results are shown for CARE sites near the transcriptional start sites of 4ebp1 and Atf5. P values compare TG-treated empty vector (EV) and TG-treated HA-ATF5 cells. n = 3. Bars in A, C, and E–H show the mean, and error bars indicate the SEM. P values were calculated with Student’s t test; *P ≤ 0.03; **P < 2 × 10⁻⁴; #P < 1 × 10⁻⁷.

