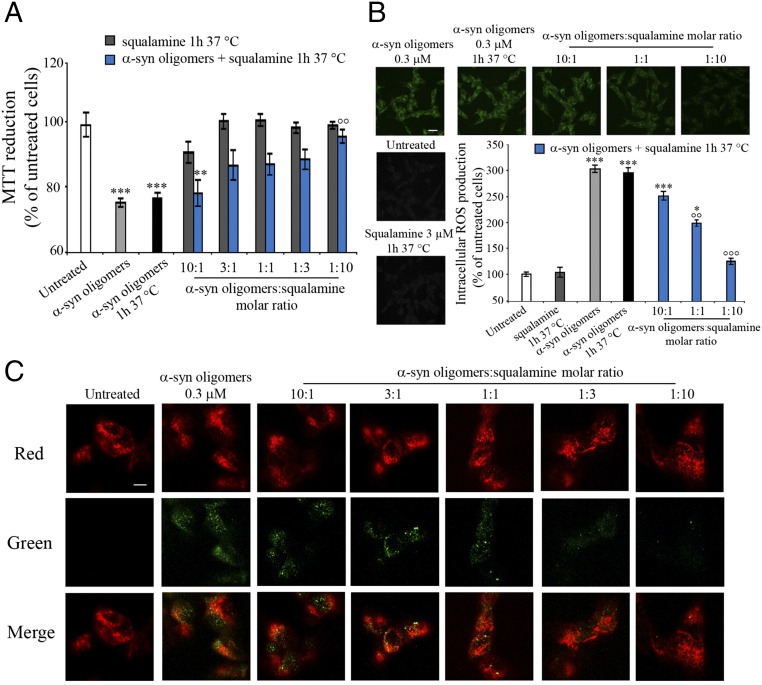
Fig. 3.
Squalamine suppresses the toxicity of α-synuclein oligomers in human neuroblastoma cells by inhibiting their binding to the cell membranes. (A) Effects of squalamine on α-synuclein oligomer-induced MTT reduction in SH-SY5Y cells. α-Synuclein oligomers (23, 24) were resuspended in the cell culture medium at a concentration of 0.3 μM, incubated with or without increasing concentrations (0.03 µM, 0.1 µM, 0.3 µM, 1.0 µM, and 3.0 µM) of squalamine for 1 h at 37 °C under shaking conditions, and then added to the cell culture medium of SH-SY5Y cells for 24 h. The cells were also treated with squalamine preincubated in the absence of oligomers for 1 h at 37 °C under shaking conditions. **P ≤ 0.01 and ***P ≤ 0.001, respectively, relative to untreated cells and °°P ≤ 0.01 relative to cells treated with α-synuclein oligomers. (B) Representative confocal scanning microscope images of SH-SY5Y cells showing the effect of squalamine on α-synuclein oligomer-induced ROS production. α-Synuclein oligomers were resuspended in the cell culture medium at a concentration of 0.3 μM, incubated with or without increasing concentrations (0.03 µM, 0.3 µM, and 3.0 µM) of squalamine for 1 h at 37 °C under shaking conditions, and then added to the cell culture medium of SH-SY5Y cells for 15 min. The cells were also treated with 3 µM squalamine preincubated without oligomers for 1 h at 37 °C while shaking. The green fluorescence arises from the 2′,7′-dichlorodihydrofluorescein diacetate (CM-H2DCFDA) probe that has reacted with ROS. (Scale bar, 30 μm.) *P ≤ 0.05, **P ≤ 0.01, and ***P ≤ 0.001, respectively, relative to untreated cells. °°P ≤ 0.01 and °°°P ≤ 0.001, respectively, relative to untreated cells and the symbol °° indicates P ≤ 0.01 relative to cells treated with α-synuclein oligomers. (C) Representative confocal scanning microscopy images of the apical sections of SH-SY5Y cells treated for 15 min with α-synuclein oligomers (0.3 µM) and increasing concentrations (0.03 µM, 0.1 µM, 0.3 µM, 1.0 µM, and 3.0 µM) of squalamine. Red and green fluorescence indicates the cell membranes and the α-synuclein oligomers, respectively. (Scale bar, 10 μm.)

