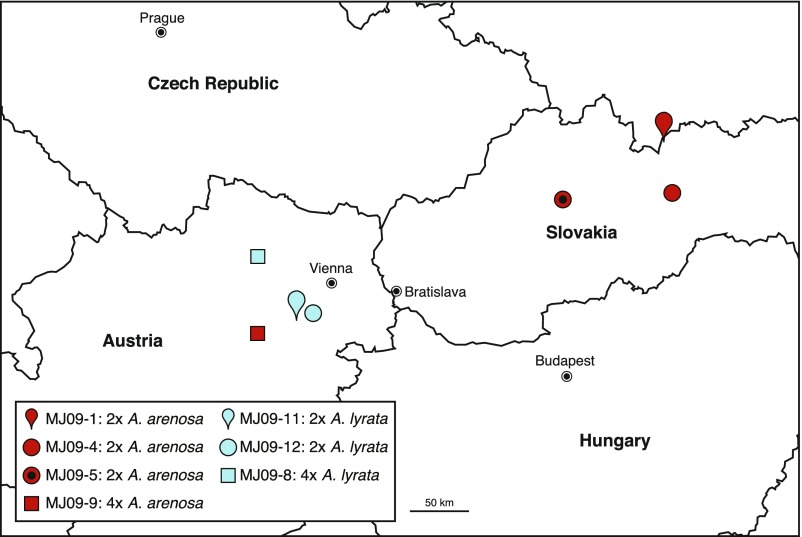
Fig. S1.
Locations of populations used in this study. Red and blue symbols represent populations of diploid and tetraploid Arabidopsis arenosa and diploid and tetraploid Arabidopsis lyrata, respectively. For more information, see Table S2. The map was modified from Google Maps.

