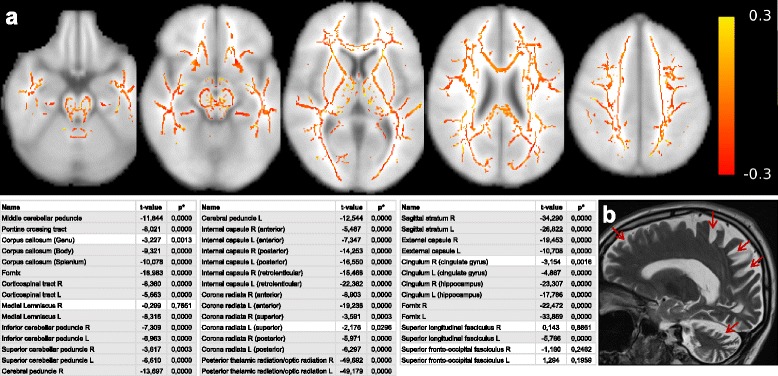
Fig. 2.

MR imaging features of an individual with STUB1/CHIP mutation. a Top: illustration of the FA differences between patient II.1, family 1 versus the healthy control group, overlaid onto a standard brain available in FSL. The mean FA skeleton was calculated voxelwise over all 9 control subjects, and then subtracted from the FA skeleton of the STUB1 patient. Red color encodes a negative difference, i.e. a decreased FA in the STUB1 subject compared to the mean FA of the controls. Yellow color encodes an increased FA in the STUB1 subject compared to the mean FA of the controls. Individual FA can theoretically range from 0 to 1, in vivo FA usually ranges between 0.05 in GM and 0.9 in large WM tracts. Over the whole skeleton negative values are much more common, in line with the statistical evaluation of whole fiber tracts: Bottom: corresponding list of all brain tracts, and the results of a t-test of the voxels of each tract comparing the STUB1 subject with the healthy control group. Tracts with gray background are statistically significant. b Sagittal T2 MRI showing marked cerebellar degeneration and global cerebral atrophy with an emphasis on the parietal and occipital lobes in subject II.1 of family 1 (arrows). FA, fractional anisotropy; FSL, FMRIB Sofware Library; GM, gray matter; WM, white matter
