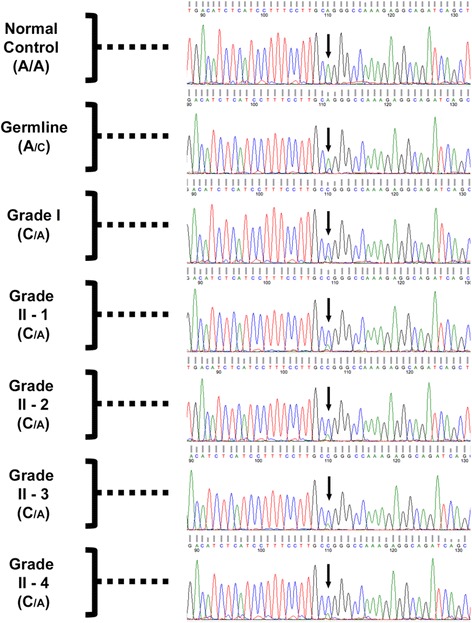
Fig. 3.

Sanger analysis of grade I and grade II tumors. Sequencing tracks of the genomic region surrounding the splice site mutation (Exon 13; c.1341-2A > C) upstream of exon 13 in the NF2 gene in normal control DNA, and germline and tumor DNA of the NF2 patient. “Grade II-1” through “Grade II-4” labels denote the four fragments of the grade II meningioma analyzed in this study. Arrows point at the mutant nucleotide, which was heterozygous in germline and all tumor fragments. The relative font size for the alleles in each sample reflects the difference in signal strength for A and C nucleotides at the site of the mutation
