
Fig. 5.
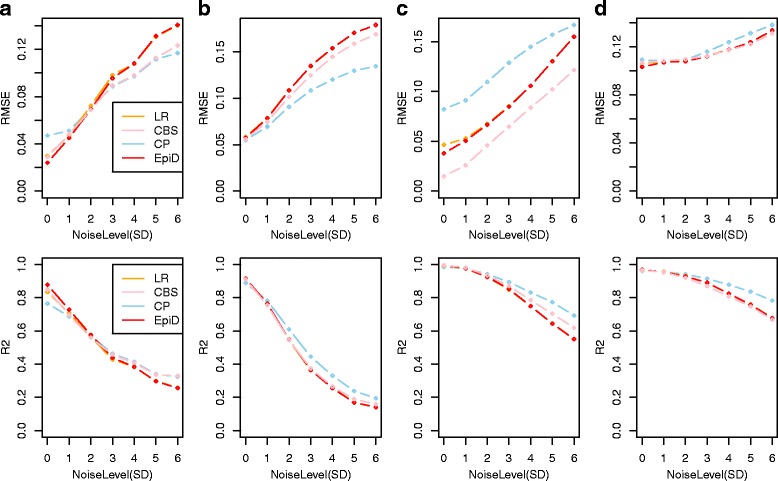
Evaluation of EpiDISH under increasing levels of noise. a RMSE (upper panel) and R2 (lower panel) values for the estimated cellular proportions for the four different algorithms as applied to the 12 reconstructed whole blood mixtures of Koestler et al. under increasing levels of noise (SD, x-axis). b As a, but for 100 in-silico randomly generated mixtures of purified blood cell subtypes, profiled in Zilbauer et al. (c) As A), but for 100 in-silico randomly generated mixtures of 3 epithelial subtypes (human mammary epithelia, human renal cortical epithelia and human pancreas). d) As A), but for 100 in-silico randomly generated mixtures of 3 epithelial/non-epithelial cell subtypes (fetal lung fibroblasts, liver and B-cells). In all panels (a-d), RMSE and R2 values represent the averages over 25 repeated Monte Carlo runs