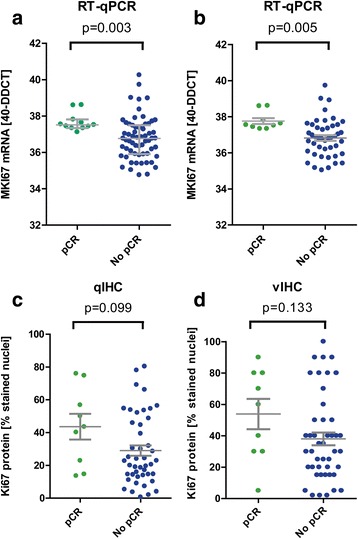
Fig. 4.

Scatter plots illustrating the distribution of RT-qPCR mRNA (upper panel) and qIHC (lower panel) and vIHC (right panel) protein measurements in relation to the groups of responders (green dots) and non-responders (blue dots). Differences were tested with the Mann-Whitney test (a = data set 1, n = 83, b, c, d = common data set, n = 54)
