Fig. 1.

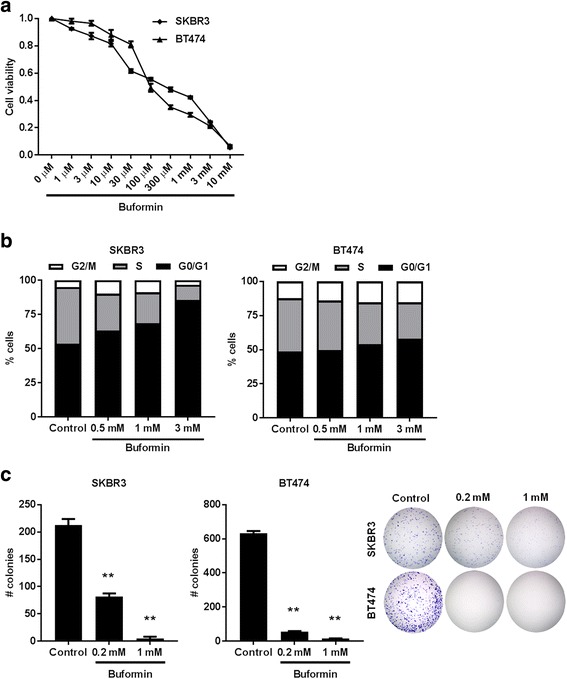
Buformin induces anti-proliferative effects in erbB-2-overexpressing SKBR3 and BT474 cells. a An MTT assay was performed to compare cell viability in SKBR3 and BT474 cells treated with buformin (0, 1, 3, 10, 30, 100, 300 μM, 1, 3, or 10 mM) for 5 days. The average viable cell fraction for each sample (N = 8) is plotted ± standard error (S.E.). b SKBR3 and BT474 cells were treated with buformin (0, 0.5, 1, or 3 mM) for 48 h and then cell cycle progression was measured using FACS analysis (N = 4). The average percentage of cells in G2/M, S, and G0/G1 phases of the cell cycle are graphed for SKBR3 (left panel) and BT474 (right panel) cells. c SKBR3 and BT474 cells were treated with buformin (0, 0.2, or 1 mM) in triplicate for 14 days as part of the clonogenic assay. Then the colonies were fixed and stained with crystal violet. The average number of colonies that formed after 14 days is graphed. Representative images of crystal violet-stained colonies are shown in the far right panel. Values are graphed as the mean ± S.E. (**p < 0.01)
