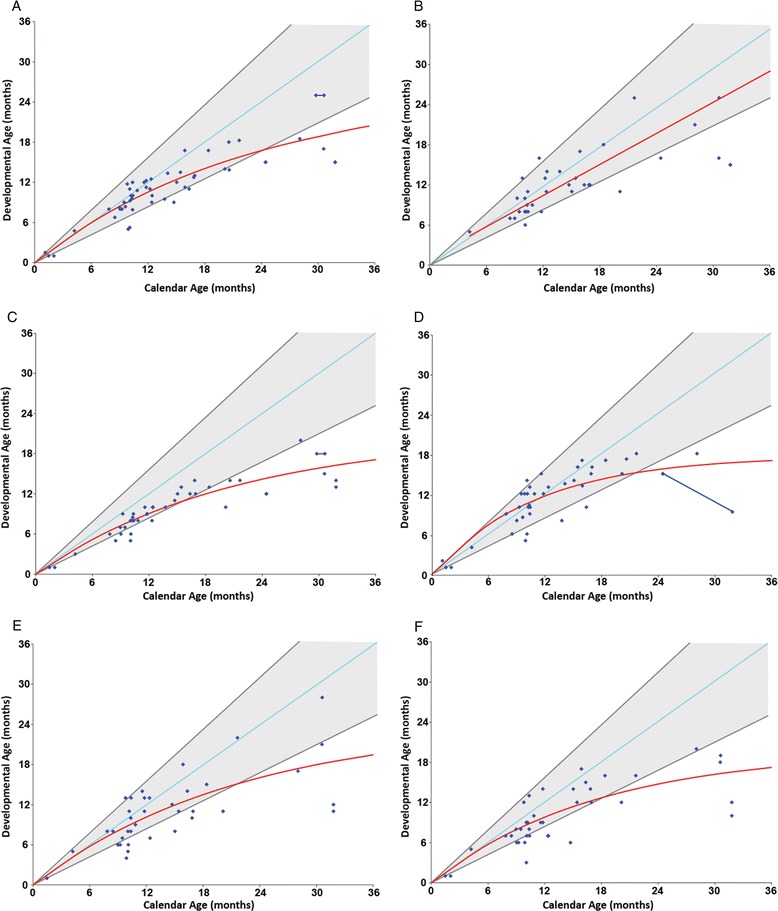
Fig. 3.

Developmental charts. The figures plot individual age-equivalent scores (y-axis) against the actual age of the patient (x-axis) for each of the developmental domains. The red line represents the estimated group mean. a Cognitive development, b adaptive behavior, c gross motor, d fine motor, e receptive language and f expressive language
