
Fig. 5.
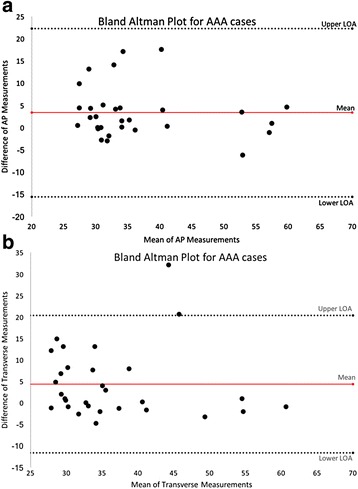
a, Title: Bland Altman Plot for AAA cases AP. x-axis show the mean aortic AP measurements, with the y-axis showing the difference of measurements between the utilized modalities, these represent AAA cases only. b, Title: Bland Altman Plot for AAA cases Transverse. x-axis show the mean aortic transverse measurements, with the y-axis showing the difference of measurements between the utilized modalities, these represent AAA cases only