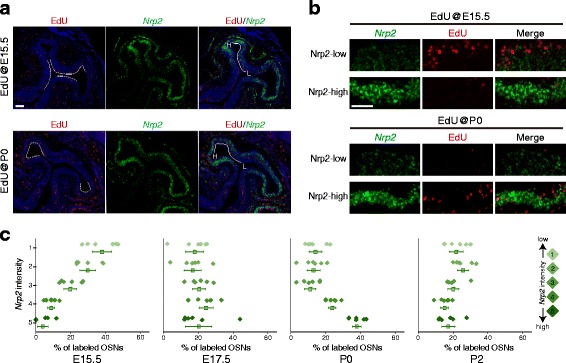
Fig. 3.

Sequential proliferation of OSNs from DM (Nrp2-low) to VL (Nrp2-high) within the V-zone of the OE. a Distribution patterns of E15.5- and P0-generated OSNs in the OE. EdU injection was performed at E15.5 and P0. After the injections, coronal OE sections from P7 mice were subjected to in situ hybridization using probes for Nrp2. EdU signals were detected with the Click reaction. EdU-positive OSNs were located in the area indicated by the dashed lines. Nrp2 can be visualized as being expressed in a DM-low to VL-high gradient. H Nrp2-high, L Nrp2-low. b Enlarged images of Nrp2-high (VL) and Nrp2-low (DL) zones. c The kinetics of OSN proliferation were spatially different within the V-zone of the OE. The ventral OE was divided into five subzones according to Nrp2 expression levels (right). The level of proliferation in each subzone was quantified as the percentage of EdU-positive cells. n = 6 areas from 3 animals, error bars indicate SEM. Scale bars, 100 μm
