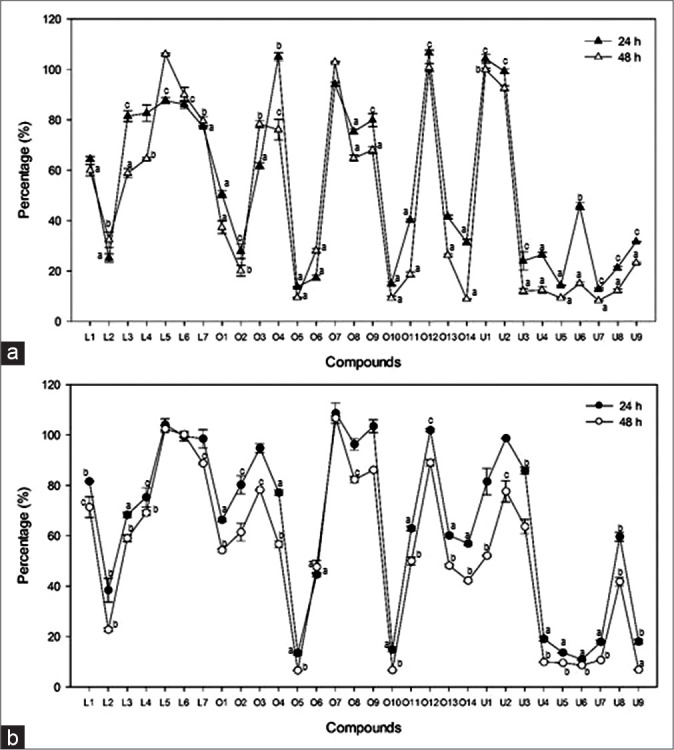
Figure 2.

The cytotoxic activity of L1-7, O1-14, and U1-9 against HepG2 and AGS cell lines. Cytotoxic effect of L1-7, O1-14, and U1-9 were evaluated against AGS (a) and HepG2 (b) cells. The cells were treated with samples at the concentration of 100 μM for 24 or 48 h as indicated in the materials and methods. Each point represents a mean ± standard deviation of 3 experiments. Doxorubicin was used as a positive control and showed IC 50 for AGS and 3.7% (24 h) and 1.5% (48 h) for HepG2, respectively. a: P < 0.001, b: P < 0.05, and c: P < 0.01 compared with control
