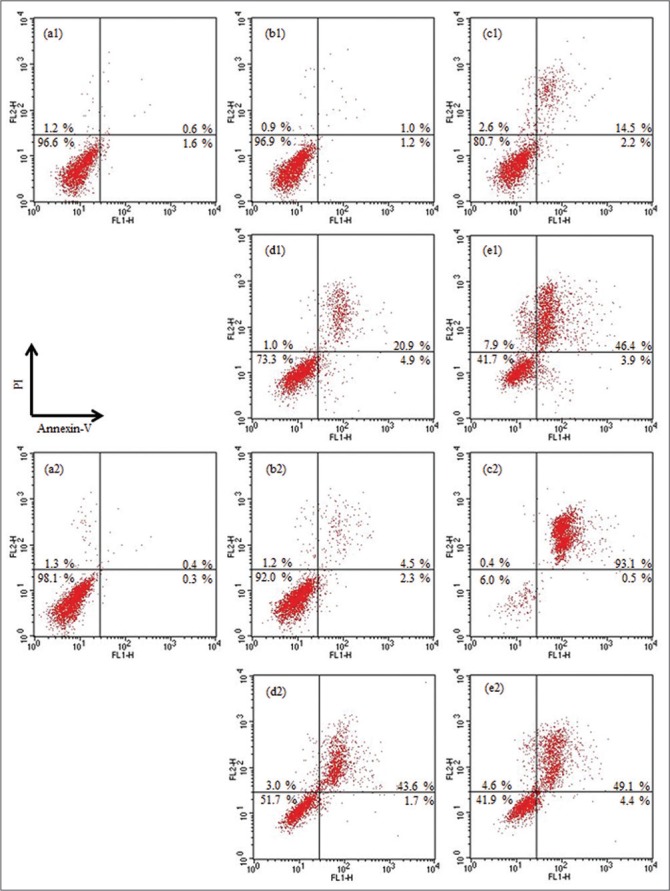
Figure 3.

The flow cytometry analysis of the stage of O5 and U5-induced apoptosis in AGS cells. After 12 (a1-e1) or 24 h (a2-e2) incubated with O5 (b and c) and U5 (d and e) at the concentrations of 10 (b and d) and 25 (c and e) μM, respectively. (a1) and (a2) were the negative controls which were treated with the vehicle. Values are represented as percentage. Data are representative of three independent experiments
