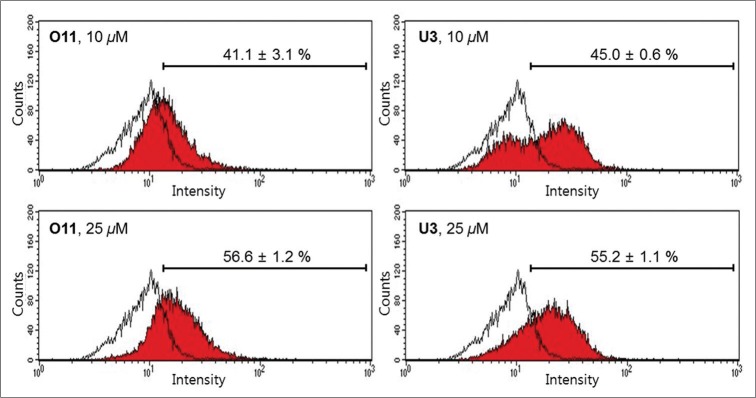
Figure 4.
The flow cytometry analysis of O5 and U5-induced caspase-3 activity in AGS cells. The cells were incubated for 24 h with vehicle (control, white color), O5 or U5 at the indicated concentration (red color). Values are represented as percentage. Data are representative of three independent experiments

