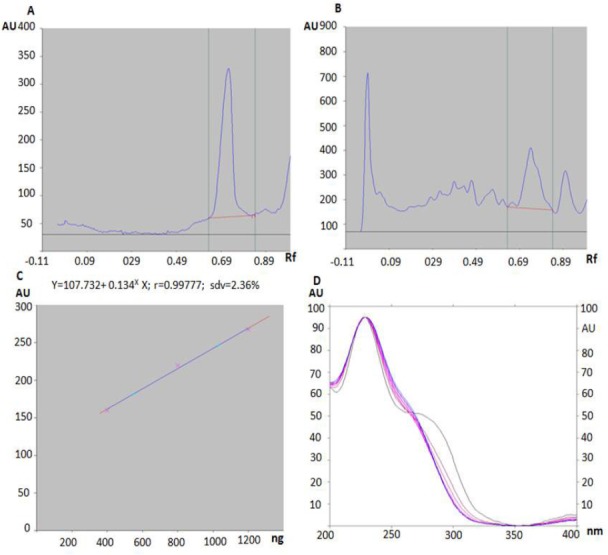
Figure 1.

HPTLC images and standardization of NJet. HPTLC densitogram of (A) marker compound valerinic acid and (B) NJet. (C) Calibration curves in linear range of 200, 400, 800, 1000, 1200 ng of standard valerinic acid. (D) UV spectra of standard valerinic acid and samples of NJet obtained by HPTLC spot scanning from 200 to 400 nm.
