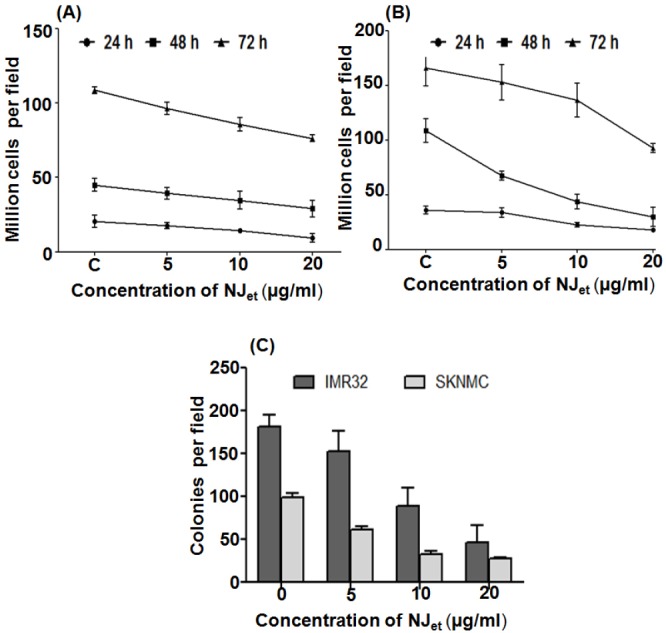
Figure 3.

Effect of NJet on growth kinetics of neuroblastoma cells. (A) IMR-32 and (B) SK-N-MC cell lines were treated with NJet (0-20 μg/ml) for 24, 48 and 72 h and the number of viable cells were counted by trypan blue dye exclusion method. Data represent mean± SD of three independent experiments (C) IMR-32 and SK-N-MC cell lines were treated with NJet (0-20 μg/ml) and grown in soft agar for two weeks. Colonies were counted from at least 10 different areas and the average of each has been plotted. The data represents mean ± SD of five independent experiments.
