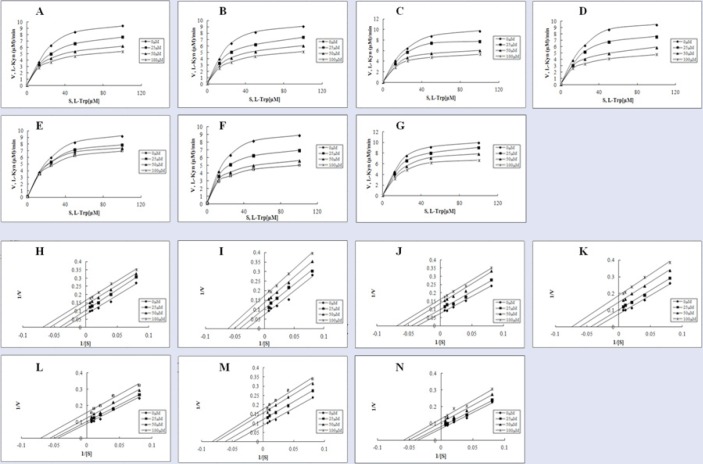
Figure 3.
The inhibition pattern of compounds 1–7. Michaelis-Menten plots with data obtained in the presence (25, 50, and 100 µM, respectively) or absence of compounds 1 (A), 2 (B), 3 (C), 4 (D), 5 (E), 6 (F), and 7 (G). Lineweaver-Burk plots [1 (H), 2 (I), 3 (J), 4 (K), 5 (L), 6 (M), 7 (N)] generated after transformation of data used in (A–G).

