
Figure 2.
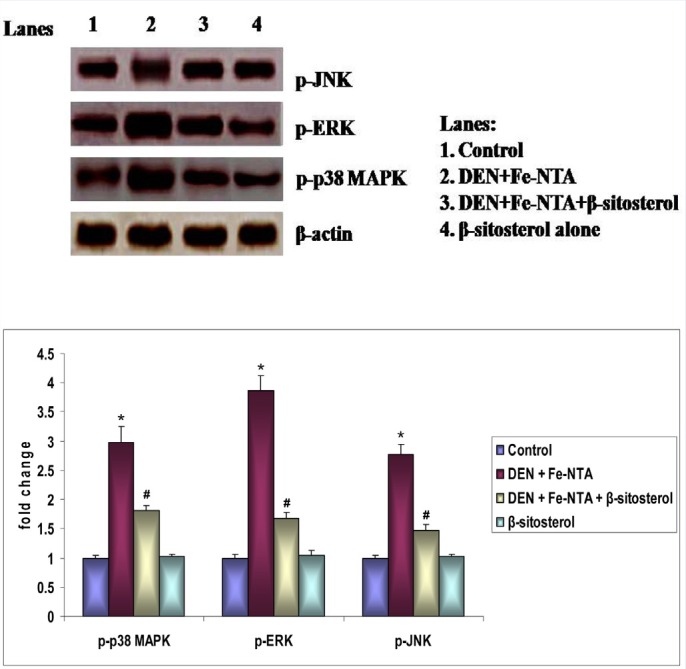
Effect of β-sitosterol on MAPKs′ protein expression in the kidney tissue of control and experimental rats. Bar diagram depicts quantification of six independent experiments (mean ± SD). Phosphorylated MAPKs′ protein expression was normalized to the expression level of total MAPKs′. Values not sharing a common superscript differ significantly at p < 0.05 (DMRT).