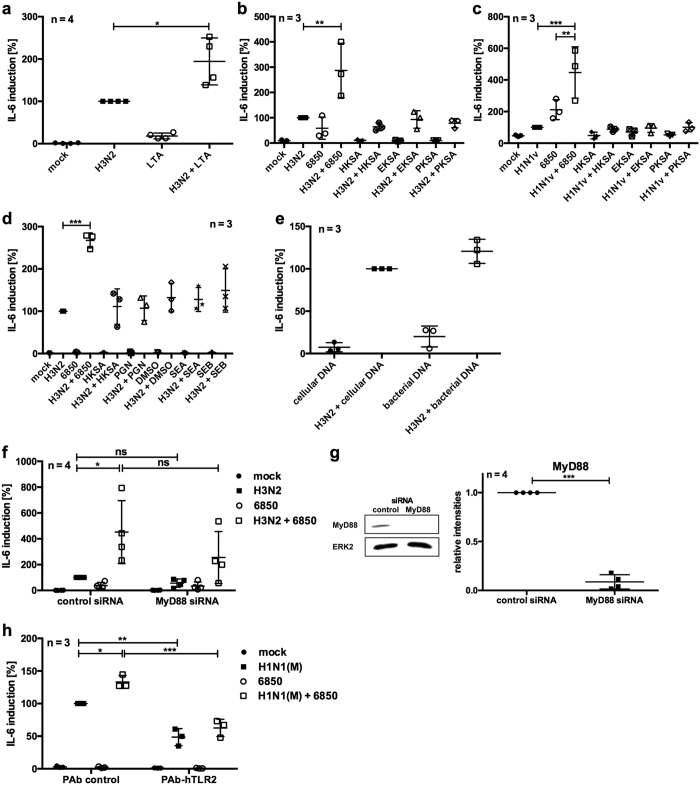
Figure 4. Co-stimulation with TLR2 ligand LTA increases IV-induced IL-6 mRNA levels.
A549 cells were infected with IV H3N2 (a,b,d–f) or H1N1v (c) (MOI 5) for 0.5 h and super-infected with S. aureus 6850, HKSA, EKSA or PKSA (MOI 50) (b–d,f) or co-stimulated with 5 μg ml−1 LTA (a), 5 μg ml−1 PGN, 0.5 μg ml−1 SEA, 0.5 μg ml−1 SEB, solvent DMSO (d), 10 μg ml−1 cellular or bacterial DNA (e) for 7.5 h. Extracellular bacteria were removed by gentamicin treatment 3 h post bacterial infection (b–d,f). Prior to infection, cells were transfected with 30 nM siRNA directed against MyD88 or control siRNA and incubated for 48 h (f,g). Protein expression was monitored by Western blot analysis (original blots are depicted in Supplementary Fig. S8a) and quantified by using ImageJ 2006.02.01 software. Means ± SD of four independent experiments are shown (g). A549 cells were infected with IV H1N1(M) (MOI 5) for 0.5 h and incubated for 3 h in DMEM/INV. Five μg ml−1 neutralising TLR2 antibody or isogenic control were added and cells were incubated for 0.5 h. Subsequently, S. aureus 6850 (MOI 50) was directly added to the cells for 4 h (h). IL-6 mRNA levels were measured at 8 h p.i. (a–f,h). Means ± SD of at least three independent experiments are shown. IV-infected (control) samples were arbitrarily set as 100%. After normalisation, two-tailed unpaired t-tests were performed for comparison between IV H3N2-infected and LTA co-stimulated samples (a) or control and treated cells (g) and one-way ANOVA followed by Dunnett’s multiple comparison tests were used to compare IV-infected and super-infected samples (b–d) or control and treated cells (f,h) (*p < 0.05, **p < 0.01, ***p < 0.001).

