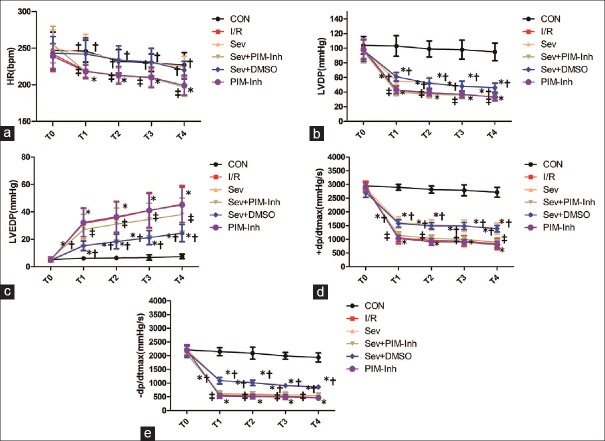
Figure 1.
Hemodynamic changes at different points in rats subjected to myocardial ischemia-reperfusion injury. (a) The changes of HR at T0–T4; (b) the changes of LVDP at T0–T4; (c) the changes of LVEDP at T0–T4; (d) the changes of + dp/dtmax at T0–T4; (e) and the changes of −dp/dtmax at T0–T4. Data were reported as mean ± SD (n = 6 for each group). *P < 0.05 versus CON; †P < 0.05 versus I/R; ‡P < 0.05 versus Sev (repeated measures ANOVA). CON: Control group; I/R: Ischemia/reperfusion; Sev: Sevoflurane postconditioning; Sev+PIM-Inh: Sevoflurane postconditioning + Pim-1 inhibitor II; Sev–DMSO: Sevoflurane postconditioning + dimethyl sulfoxide; PIM-Inh: Pim-1 inhibitor II; T0: The end of equilibration; T1: 30 min of reperfusion; T2: 60 min of reperfusion; T3: 90 min of reperfusion; T4: 120 min of reperfusion; HR: Heart rate; LVDP: Left ventricular developed pressure; LVEDP: Left ventricular end-diastolic pressure; +dp/dtmax: Maximum rate of left ventricular development pressure; −dp/dtmax: Maximum rate of left ventricular fall pressure; SD: Standard deviation; ANOVA: Analysis of variance.

