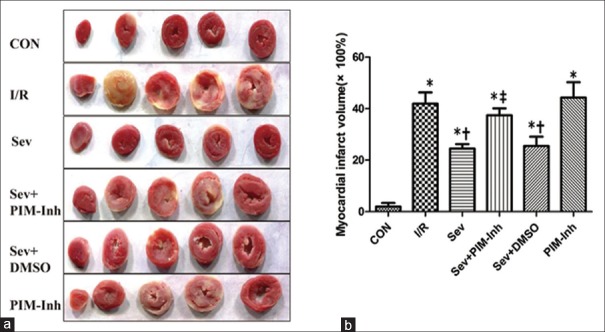
Figure 4.
Myocardial infarct size of isolated hearts in six groups. (a) Representative cross sections of rat hearts from six groups after I/R and staining with TTC to visualize the infarcted area; (b) infarct size expressed as percentage of the left ventricular area (×100%) for each group. Values are represented as mean ± SD (n = 6 for each group), *P < 0.05 versus CON; †P < 0.05 versus I/R; ‡P < 0.05 versus Sev (one-way ANOVA). CON: Control group; I/R: Ischemia/reperfusion; Sev: Sevoflurane postconditioning; Sev+PIM-Inh: Sevoflurane postconditioning + Pim-1 inhibitor II; Sev+DMSO: Sevoflurane postconditioning + dimethyl sulfoxide; PIM-Inh: Pim-1 inhibitor II; SD: Standard deviation; ANOVA: Analysis of variance.

