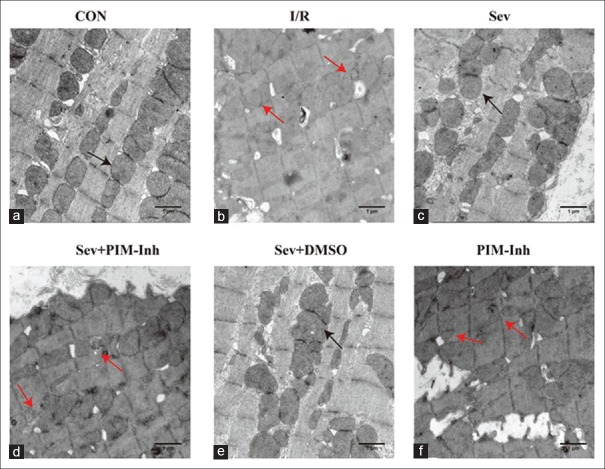
Figure 5.
Transmission electron microscope (uranyl acetate-lead citrate stained, original magnification ×30,000) performance of the myocardial mitochondria in six groups. (a) In the CON group, the mitochondria were normal (b) in the I/R group, the mitochondria appeared small, irregular, and less dense cristae (c) in the Sev group, the severity of mitochondrial injury decreased compared with the I/R group (d) in the Sev+PIM-Inh group, the severity of mitochondrial injury increased compared with the Sev group (e) in the Sev+DMSO group, no significant changes were found compared with the Sev group (f) in the PIM-Inh group, no significant changes were found compared with the I/R group (n = 3 for each group, scale bar = 1 μm). The black arrow shows normal mitochondria, and the red arrow shows fragmented mitochondria. CON: Control group; I/R: Ischemia/reperfusion; Sev: Sevoflurane postconditioning; Sev+PIM-Inh: Sevoflurane postconditioning + Pim-1 inhibitor II; Sev+DMSO: Sevoflurane postconditioning + dimethyl sulfoxide; PIM-Inh: Pim-1 inhibitor II.

