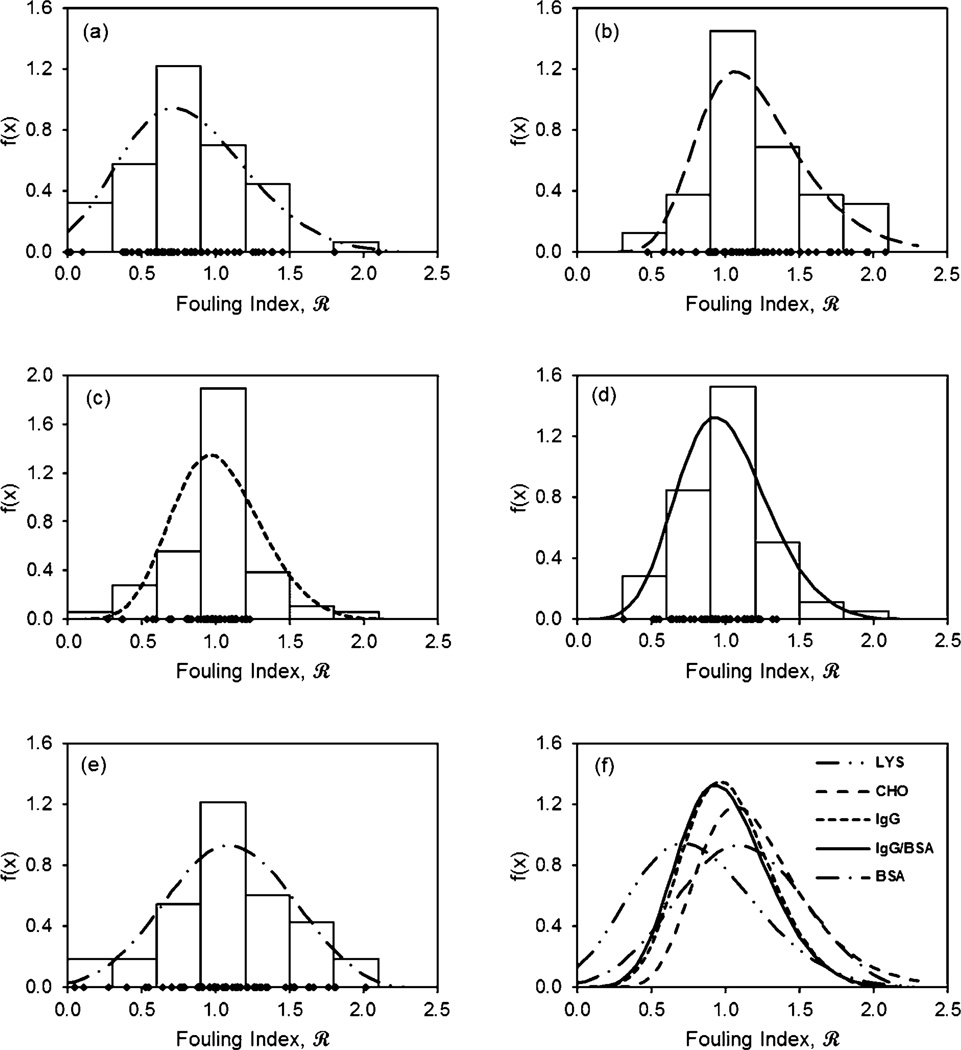
Fig. 2.
Measured (histogram) and best fit General Extreme Value (lines) fouling index distributions for (a) hen egg lysozyme solution in PBS at 1 mg ml−1; (b) Chinese hamster ovary cell supernatant in PBS at ~4 mg ml−1 total protein with 1 mg ml−1 IgG; (c) IgG precipitate with 0.5 mg ml−1 IgG; (d) IgG precipitate with 0.25 mg ml−1 IgG in the presence of 0.25 mg ml−1 of BSA; (e) BSA solution in PBS at 1 mg ml−1; and (f) comparison of fitted distributions. Points on the x-axis show location of measured fouling indices. Histogram bin size shown corresponds approximately to one standard deviation in the fouling index data over the range 0 to ±2.

