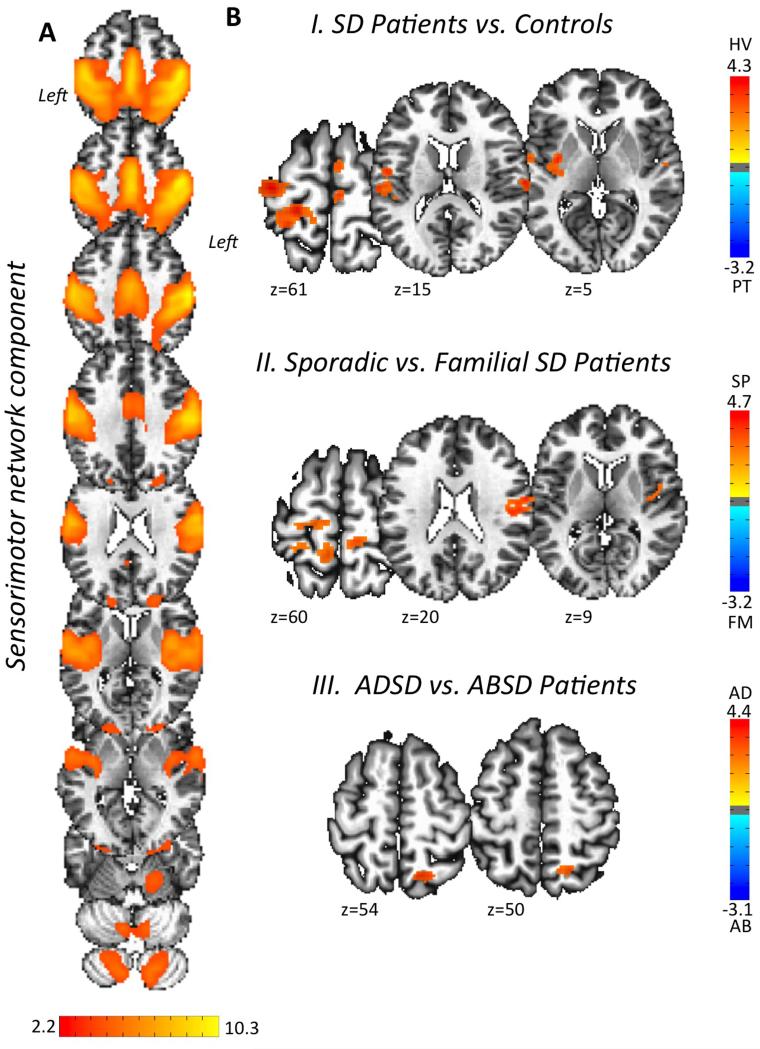
Figure 1. Sensorimotor functional network alteration assessed using independent component analysis (ICA).
Panel (A) shows the sensorimotor network extracted across all SD patients and controls. Voxel-based inferential statistics were used to compare (B-I) all SD patients vs. healthy controls, (B-II) sporadic vs. familial SD patients, and (B-III) ADSD vs. ABSD patients. Statistical maps are superimposed on a series of axial slices of the standard brain in Talairach-Tournoux space. The color bars represent Z scores for independent components and t scores for group statistical comparisons (p ≤ 0.01, FWE-corrected). AB – abductor SD patients; AD – adductor SD patients; FM – familial SD patients; HV – healthy control volunteers; PT – patients; SD – spasmodic dysphonia; SP – sporadic SD patients.

