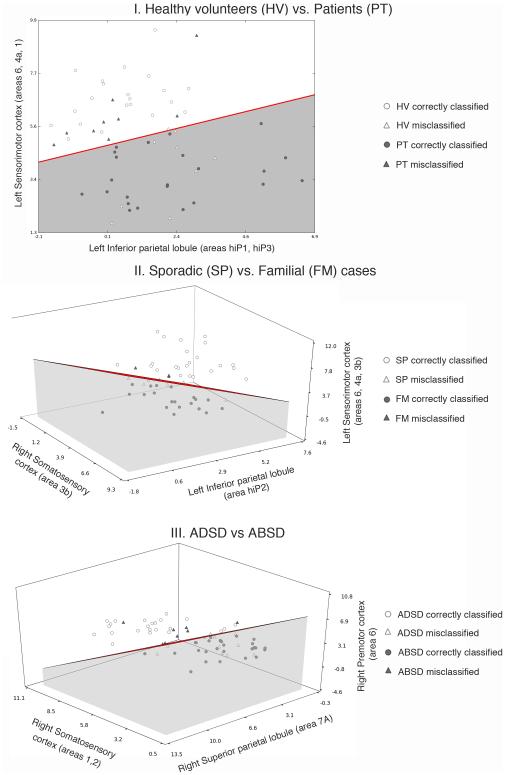
Figure 3. Results of the linear discriminant analysis of (I) SD patients vs healthy volunteers, (II) sporadic vs familial SD patients, and (III) ADSD vs ABSD patients.
The scatter plots show the individual combinations of the mean values of the Z score within (I) the left sensorimotor and the left inferior parietal cortices in patients (gray circles for correct classification and gray triangles for misclassification of patients) and healthy volunteers (empty circles for correct classification and empty triangles for misclassified helthy volunteers); (II) the left inferior parietal lobule, right somatosensory, and left sensorimotor cortices in sporadic SD (empty circles for correct classification and empty triangles for misclassification of sporadic patients) and familial SD (gray circles for correct classification and gray triangles for misclassification of familial patients); (III) the right superior parietal lobule, somatosensory and premotor cortices in ABSD (gray circles for correct classification and gray triangles for ABSD patients misclassified) and ADSD (empty circles for correct classification and empty triangles for misclassified ADSD) patients. The red line (I) and red planes (II and III) represent the decision boundary of the classification. The corresponding values are provided in Table 3. AB – abductor SD patients; AD – adductor SD patients; FM – familial SD patients; HV – healthy control volunteers; PT – patients; SP – sporadic SD patients.

