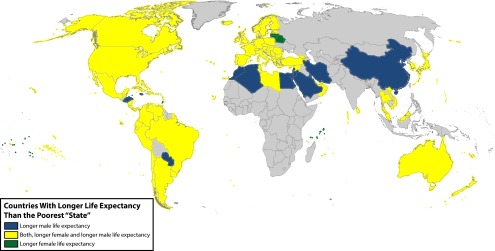
FIGURE 3—
Comparison of Poorest “State’s” Male and Female Life Expectancies to International Life Expectancies
Note. Poorest “state’s” male and female life expectancies drawn from 2013 data. International life expectancies drawn from 2010 data.
Source. Institute for Health Metrics and Evaluation19 and United Nations Department of Economic and Social Affairs.20

