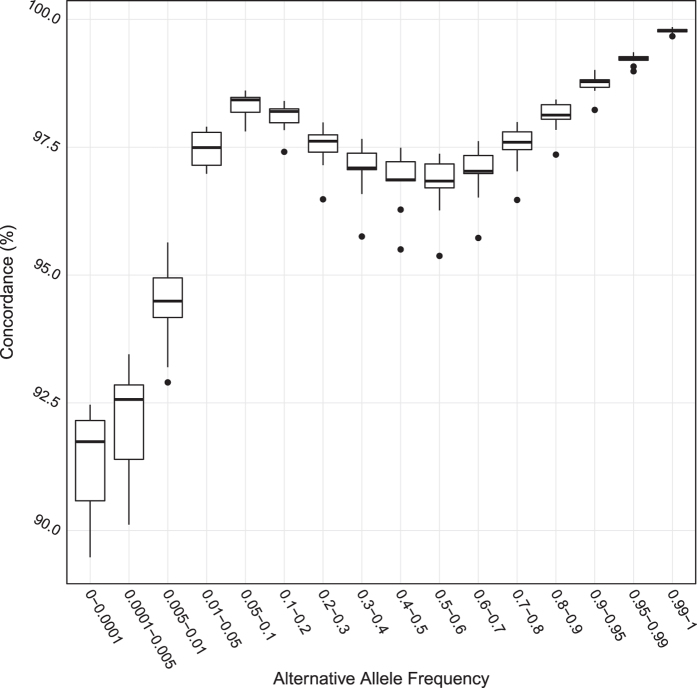
Figure 2. Percentage concordance between hard-called genotypes from imputed genotype probabilities and genotypes called from 10x coverage sequencing in nine samples.
This figure shows the percentage concordance between genotypes from imputation (hard-called as the genotype with the maximum imputed genotype probability, barring those where the maximum genotypes probability was smaller than 0.9 in which case the genotypes was considered missing) and genotypes directly called from 10x coverage sequencing data in nine samples. Each box contains data points for nine samples; the vertical axis shows the percentage of SNPs per sample in each alternative allele frequency bracket (horizontal axis) with concordant genotypes between the two datasets.

