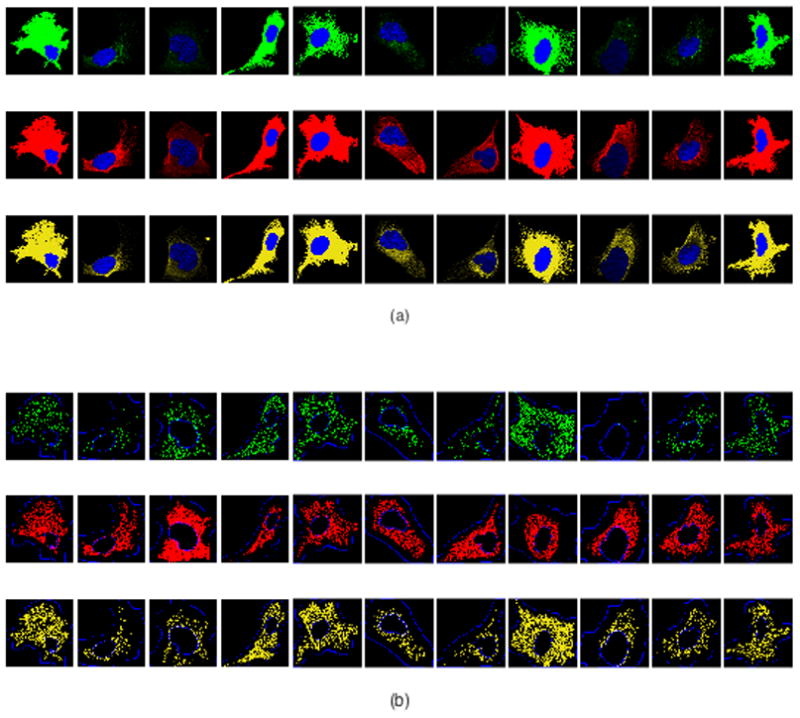
Figure 1.

Illustration of initial image processing. Founders in cell type U-2OS (from left to right): COPE, SEC23B, FLOT1, CLTA, EEA1, RAB7A, TMEM192, CAT, APC, TFRC, and VPS35. (a) Representative original images depicting stains for nucleus (blue), microtubules (red), ER (yellow) and the specific protein (green). (b) Processed images showing nuclear and cell boundaries (blue), discretized microtubules (red), discretized ER landmarks (yellow) and detected puncta locations (green).
