
Figure 2.
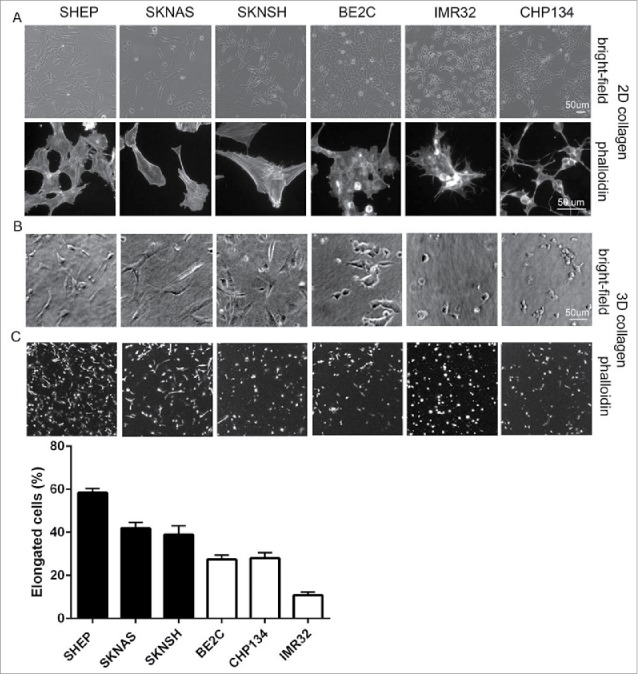
Morphology of single neuroblastoma cells in 2D versus 3D collagen environments. (A) Representative images of the indicated cell lines grown on collagen coated coverslips (2D). Shown are bright-field images (top panels) and cells fixed and stained with fluorescently-tagged phalloidin (bottom panels). (B) Bright-field images of single cell suspensions in 3D collagen. (C) Phalloidin-stained cells in 3D collagen gels. Histogram below shows the percentages of elongated cells for each cell line, data for cells lacking MYCN amplification represented in the black bars and MYCN amplified in the white bars.