
Figure 3.
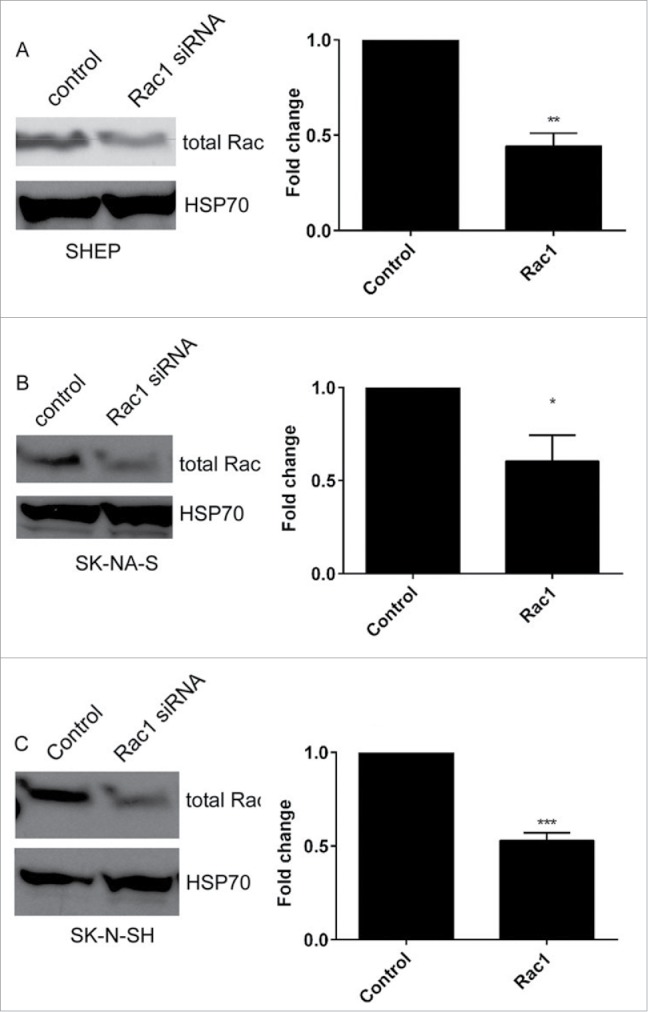
Rac1 depletion. A–C. Western blots showing total Rac expression in (A) SHEP, (B) SK-N-AS and (C) SK-N-SH cells, following treatment with Rac1 siRNA. HSP70 expression is shown to confirm equal protein loading. Histograms show the corresponding quantification of total Rac protein expression after siRNA, as indicated. Data shown are the average fold change relative to control siRNA from triplicate biological repeats. * p < 0.05; ** p < 0.01, *** p < 0.001, Students' t-test.