
Figure 6.
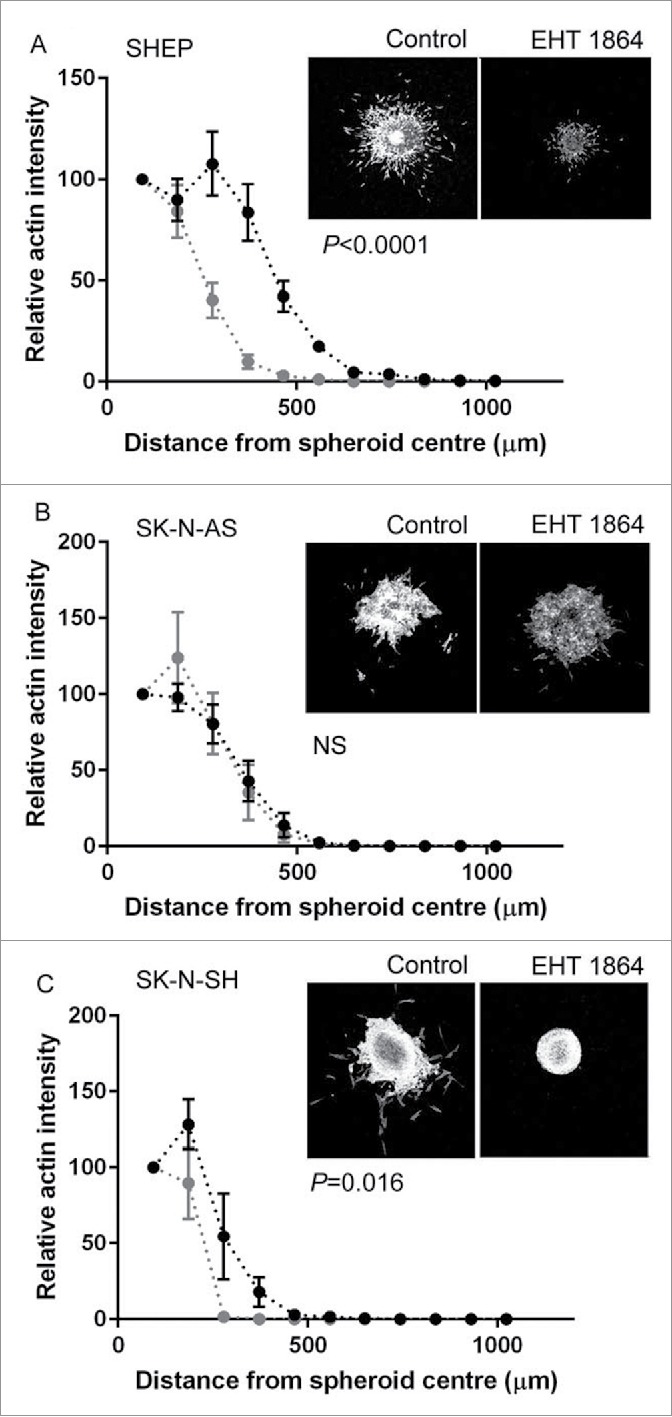
Rac GTPase regulation of MCS invasion. (A–C) Line graphs showing quantification of spheroid invasion, measured by relative actin intensity over the distance from the spheroid center for the indicated cell lines. Black dots and lines show data for control spheroids, gray dots and lines show data for MCS treated with EHT 1864 to inhibit Rac activity. Statistical comparisons performed using 2-way ANOVA. Also shown are representative confocal images (maximum projection) for spheroids embedded in collagen, after 48 hours of incubation under the indicated conditions.