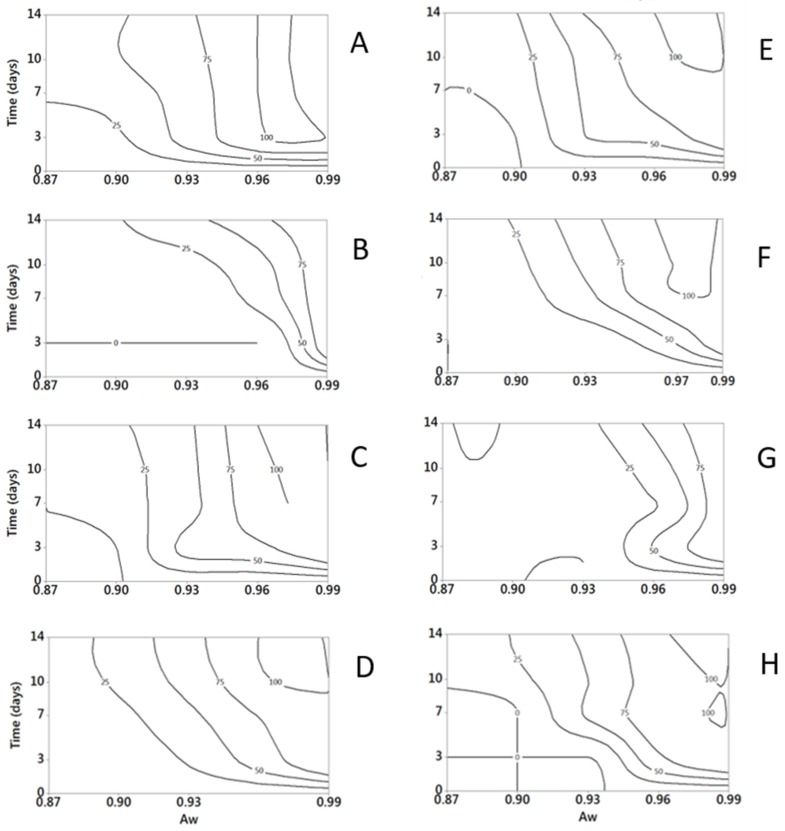
Figure 1.
Surface response curves of fungal relative growths (expressed as percentage on the maximum growth, numbers on the isoplethes) at different incubation times (3, 7, 10, 14 days) under different T regimes (0–40 °C, step 5 °C; aw = 0.99). (A) A. versicolor; (B) P. camemberti; (C) P. citrinum; (D) P. crustosum; (E) P. nalgiovense; (F) P. nordicum; (G) P. roqueforti; (H) P. verrucosum.

