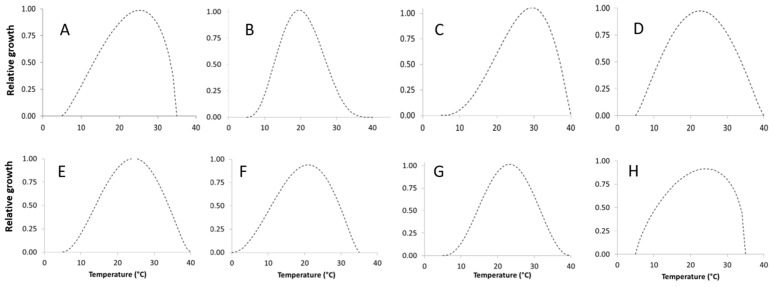
Figure 4.
Dynamic of relative growth of the studied fungi, at different temperature regimes (0–40 °C). Data were fitted by a Bete function (see Table 3 for equation parameters). (A) A. versicolor; (B) P. camemberti; (C) P. citrinum; (D) P. crustosum; (E) P. nalgiovense; (F) P. nordicum; (G) P. roqueforti; (H) P. verrucosum.

