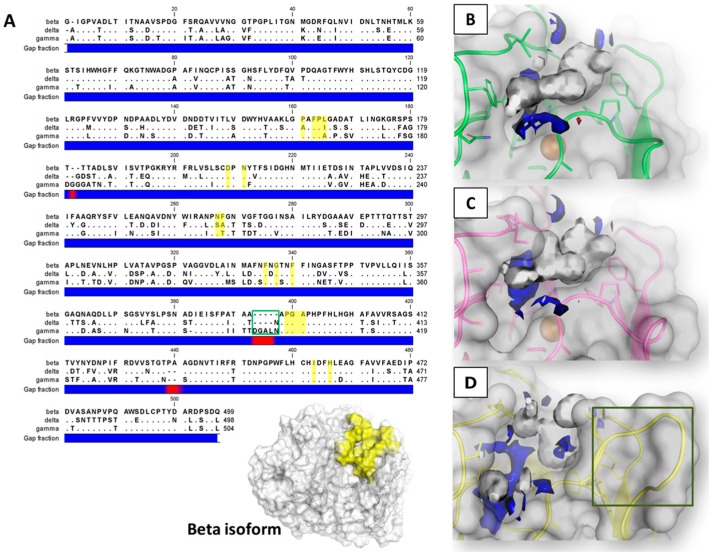
Figure 2.
The sequence alignment (A) and pharmacophoric analysis of beta (B), gamma (C) and delta (D) laccase isoforms from T. versicolor. In the sequence alignment (box A), dots represent matching residues while dashes indicate gaps (red spots in the gap fraction blue bar). Residues of the binding site are highlighted in yellow while the green box indicates an extended region of the gamma isoform lining the catalytic site. The overall 3D structure of the beta isoform is also reported to provide localization of the binding site (colored in yellow). In the pharmacophoric analysis (boxes B, C and D), white, red, and blue contours identify regions sterically and energetically favorable for hydrophobic, H-bond acceptor, and H-bond donor groups, respectively. Spheres indicate Cu ions. The green box indicates the extended region of the gamma isoform.

