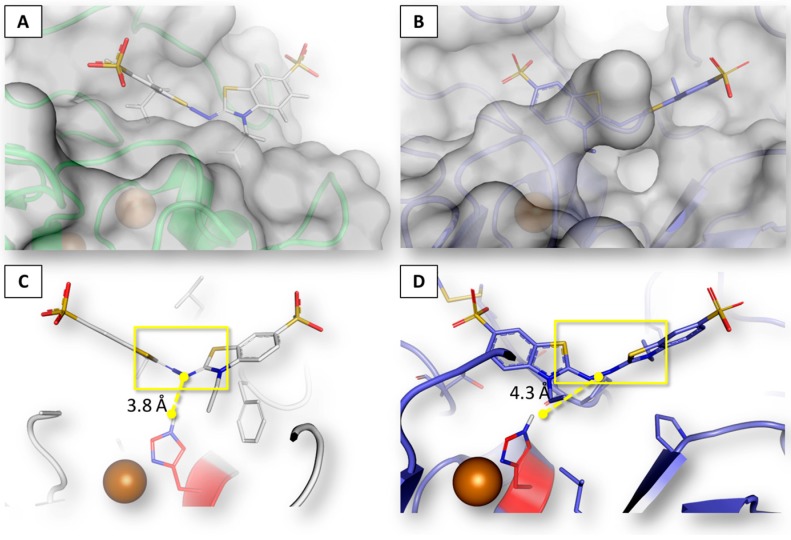
Figure 3.
Binding architecture of ABTS. Proteins are represented in cartoon and surface, ABTS and residues of binding sites are represented in sticks. Cu at the T1 site is represented by the red sphere and the catalytic histidine is colored in red. ABTS electron donor region is highlighted with the yellow box, while interatomic distances are indicated by yellow dashed lines. (A) calculated surface interaction with beta laccase from T. versicolor; (B) crystallographic surface interaction with CotA laccase from Bacillus subtilis [29]; (C) detail of binding architecture with beta laccase from T. versicolor; and (D) detail of binding architecture with CotA laccase from B. subtilis [29].

