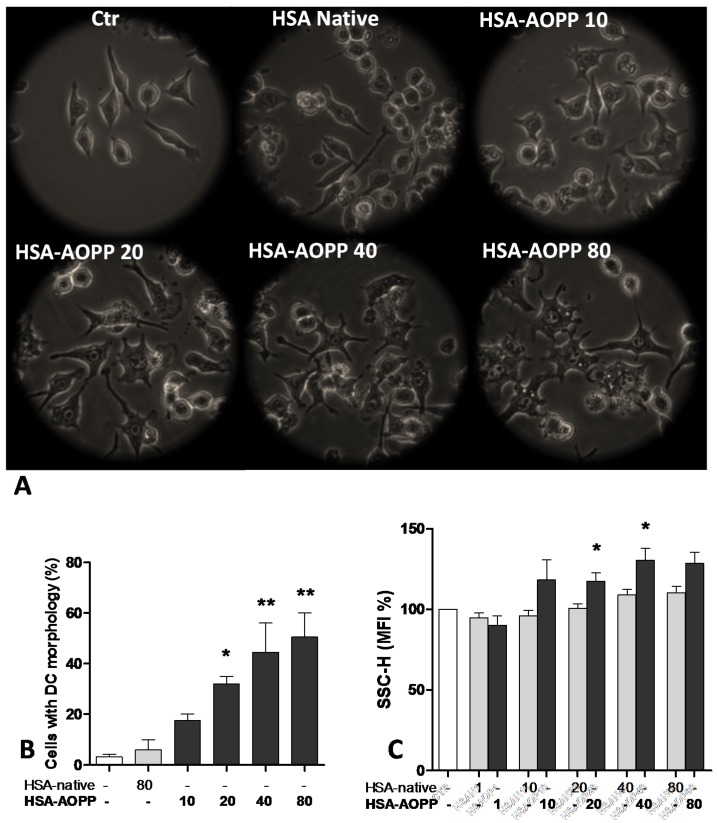
Figure 1.
(A) Phase contrast microscopy of RAW cells cultured with different HSA-AOPP concentrations (magnification 100×); (B) Percentage count of RAW cells observed by phase contrast microscopy. Data represent mean + SE. * p < 0.05, ** p < 0.01, *** p < 0.001 vs. untreated cells; (C) Flow cytometric evaluation of RAW cell complexity as a percentage of Mean Fluorescence Intensity (MFI) of side scatter (SSC-H). Data represent mean + SE. * p < 0.05 vs. native HSA.

