Figure 1.
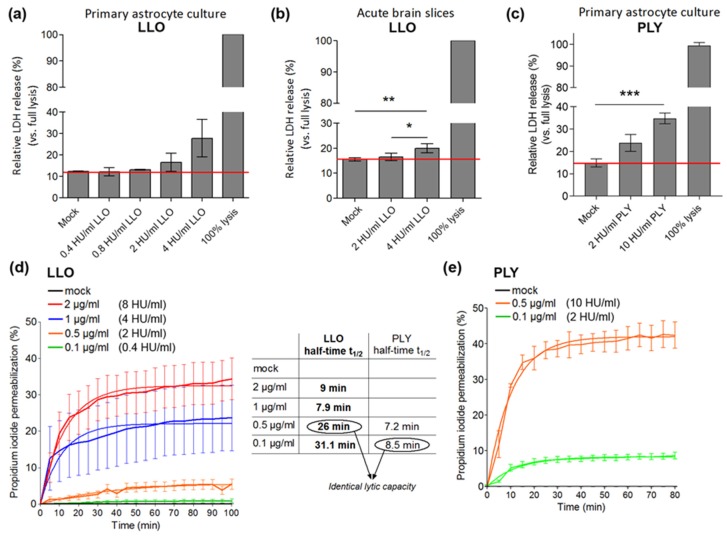
Lytic capacity of listeriolysin O (LLO) in primary glial cells: (a) lactate dehydrogenase (LDH) release in primary glial cells after challenge with various concentrations of LLO for 30 min. The red line indicates background LDH release; (b) LDH release in acute brain slices, oxygenated with carbogen (95% O2/5% CO2 mix) after 5 h of LLO exposure; (c) LDH release in primary glial cultures after challenge with various concentrations of pneumolysin (PLY) for 30 min. 100% lysis controls were prepared by cell lysis with 1% Triton X-100 in PBS; (d) live imaging permeabilization (as judged by propidium iodide nuclear staining) analysis in primary mouse glial cultures after challenge with various amounts of LLO and (e) PLY. Total number of cells per field was determined by DAPI nuclear staining at the end of the experiment. Values from non-linear regression analysis of half-times are presented in the table. In (d,e), toxin concentrations were expressed both as µg/mL and in hemolytic units (HU/mL). All values represent mean ± SEM, n= 4–6 independent experiments; * p < 0.05, ** p < 0.01, *** p < 0.001.

