Figure 3.
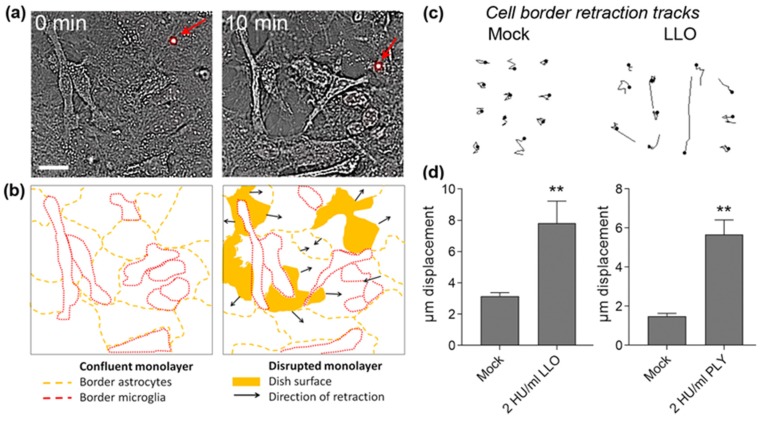
Displacement and cell shape changes of primary astrocytes after LLO exposure: (a) transmission images demonstrating a disruption of the glial monolayer (confluent at 0 min) and retraction of non-permeabilized cells (10 min). A PI-labelled cell is visible in the field (red arrow). Scale bars: 20 µm; (b) schematic presentation of the cell borders of individual glial cells in (a) with outline of the retraction direction and areas of monolayer disruption; (c) tracks of cell border displacement of non-permeabilized cells (pooled together; see Materials and Methods for details). Scale bars: 20 µm; (d) significant increase of cell border displacement after challenge with 2 HU/mL LLO. Cell border retraction by 2 HU/mL PLY is presented on the right graph. All values represent mean ± SEM, n = 40 cells; ** p < 0.01.

