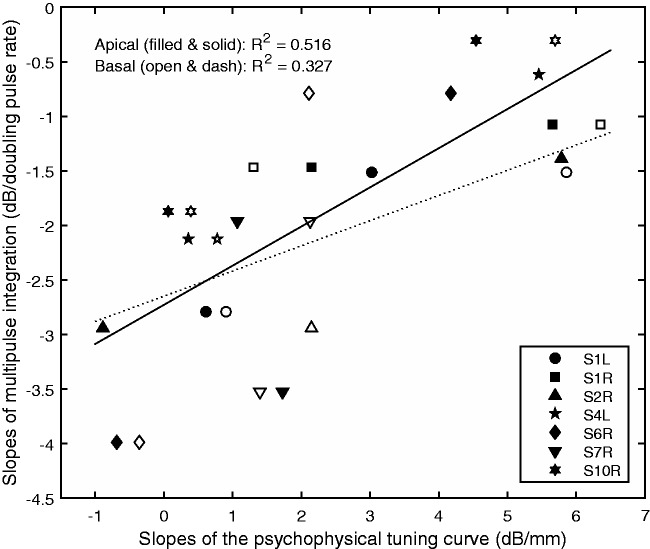
Figure 4.
Scatter plot of the slopes of the multipulse integration functions against the apical (filled symbols) and basal (open symbols) slopes of the tuning curves. Stimulation sites and ears are collapsed in the plot. The line represents linear fit to the data. The R-squared values were corrected for examining two sources of variances in the general linear models.

