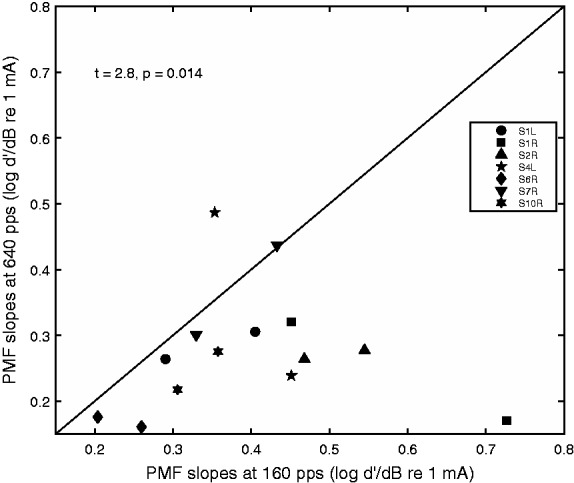
Figure 7.

Scatter plot of the slopes of the psychometric functions for detection for the 640 pps stimulus against the slopes for the 160 pps stimulus. Stimulation sites and ears are collapsed in the plot. Symbols represent ears. Statistics for the t test comparing the slopes for the two stimuli are shown on the upper left corner of the plot.
