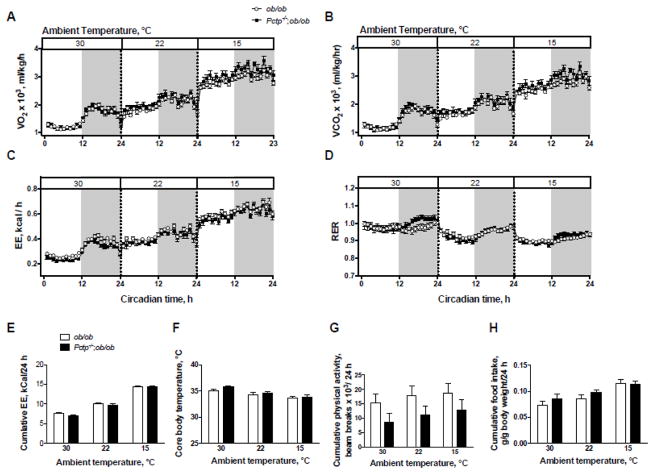
Figure 2.
PC-TP expression does not affect EE in absence of leptin. Values of (A) VO2 and (B) VCO2 were determined by indirect calorimetry (n = 11–14/group). Values of (C) EE and (D) RER were calculated from VO2 and VCO2 as described in section 2.3 of the text. Vertical dotted lines denote intervening 48 h equilibration periods. White background denotes light hours and gray denotes dark hours. (E) Cumulative EE values over 24 h were adjusted for lean body mass by ANCOVA. (F) Core body temperatures following 48 h acclimation. (G) Cumulative physical activity over 24 h. (H) Cumulative food intake. Data are mean +/− SEM.

