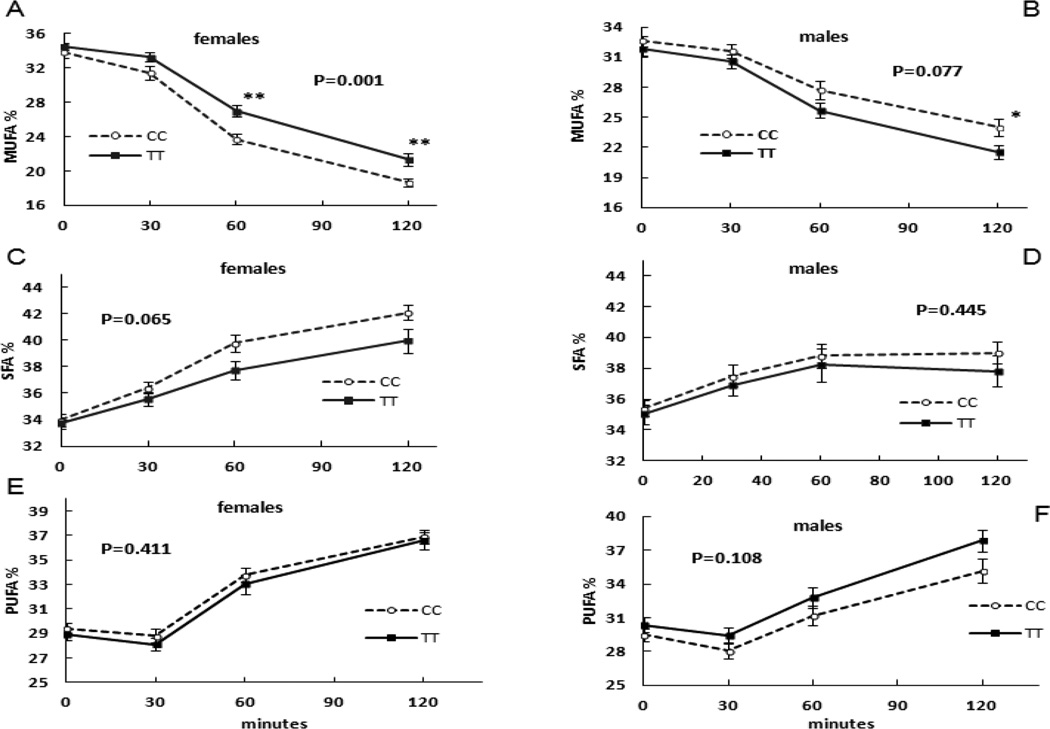
Figure 2.
The influence of TCF7L2 rs7903146 genotype on plasma fatty acids concentrations during OGTT after stratification by sex. Panels A and B depict the changes in % MUFA during OGTT in females and males, respectively. Panels C and D depict the changes in % SFA during OGTT in females and males, respectively. Panels E and F depict the changes in % PUFA during OGTT in females and males, respectively. P values are for the repeated-measures ANOVA; P=0.001 in Panel A was statistically different % MUFA during OGTT between female CC and TT carriers. * P<0.05, ** P<0.01 by non-paired t-test.

