Figure 4.
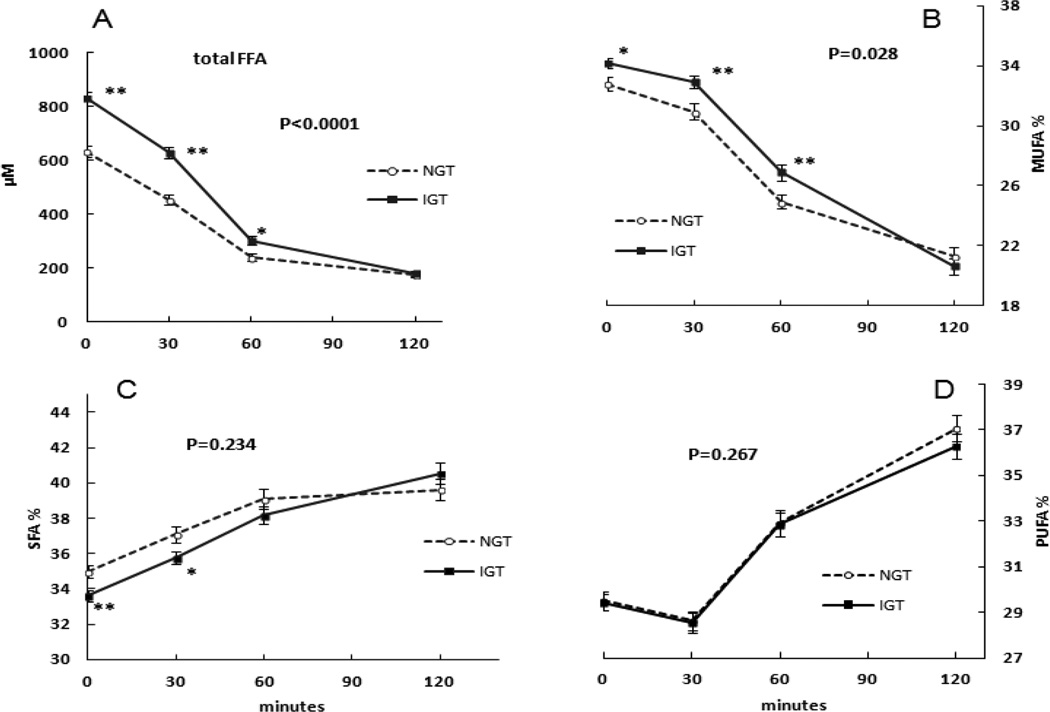
The differences of plasma fatty acids concentrations during OGTT between NGT and IGT subjects. The Mean ± SEM plasma total FFA (P<0.0001, panel A) and % MUFA (P=0.028, panel B) during the OGTT in NGT and IGT subjects were significantly different by repeated-measures ANOVA. There were no significant differences in % SFA (P=0.234, panel C) or % PUFA (P=0.267, panel D) between NGT and IGT subjects during the OGTT by repeated-measures ANOVA. * P<0.05, ** P<0.01 by non-paired t-test.

