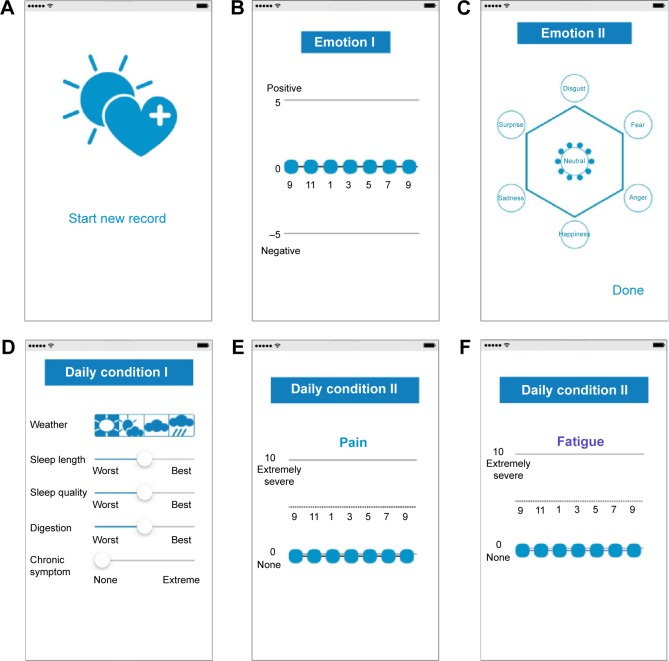
Figure 1.
Structure of the “Mind Mirror” mobile application.
Notes: (A) Starting page for the Mind Mirror mobile application; clicking on “Start new record” changes the application screen to the next figure. (B) Explicit measurement of Emotion I. The blue circle in the middle line is moved by the participant to express the level of emotional valence, which has a range from −5 to 5 and is measured every 2 hours from 9:00 AM to 9:00 PM. (C) Explicit measurement of Emotion II. The hexagon represents a circumplex model of six distinct emotions according to Ekman: happiness, anger, fear, disgust, surprise, and sadness. A single click on one of the six emotions moves the blue circle at the center to the clicked emotion. The participant can divide 10 blue circles into different emotions to illustrate the type and strength of the emotions that he or she felt during the day. (D) Basic health information of a patient throughout the day. The participant was asked to choose the weather of the day by clicking on one of the various weather icons. They were then asked to note the length and quality of sleep the previous night by moving a button within a bar that ranged from “Worst” to “Best”. Similarly, the participants rated digestive function throughout the day. Chronic symptoms were identified prior to the trial; moving the button within a bar that ranged from “None” to “Extremely severe” changed the severity of the daily symptoms over 30 days, which the patient could track. (E) Measurement of pain. The blue circle in the bottom line was moved by the participant to express the level of pain during the day. (F) Measurement of fatigue. The blue circle in the middle line was moved by the participant to express the level of fatigue during the day.

