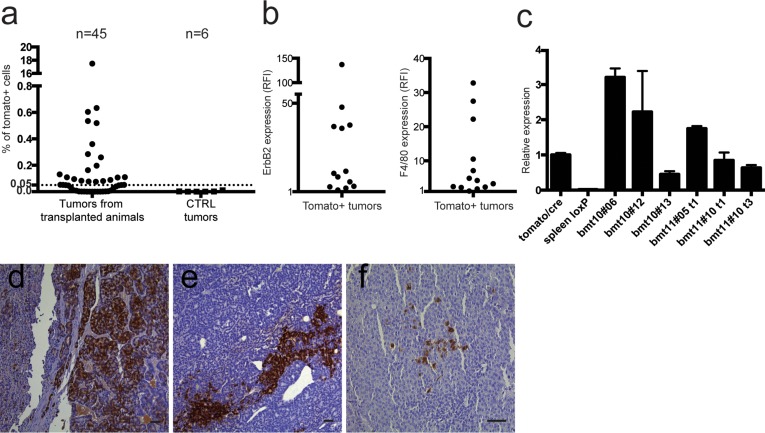
Figure 5. Analysis of Tomato positive cells.
a. 26 out of 45 (57.7%) tumors analyzed by flow cytometry were positive for Tomato expression, restricted to the CD45− compartment, above an arbitrary threshold of 0.05% of live cells. None of the tumors of control animals (MMTV-neu and LoxP-tdTomato/neu mice) showed any Tomato+ cells. b. The left panel shows ErbB2 expression ratio between the CD45−/Tomato+ population and the same tumor population stained with isotypic control, expressed as Relative Fluorescence Intensity (RFI). The right panel shows F4/80 expression ratio between the CD45−/Tomato+ population and the same tumor population unstained for F4/80, expressed as RFI. Thirteen out of 26 tumors (50%) express both F4/80 and ErbB2 in the CD45−/Tomato+ compartment. c. qRT-PCR of Tomato expression in CD45−/Tomato+ sorted tumor cells obtained from tumors originated in transplanted Tomato/neu animals, relative to constitutively expressing Tomato/CRE cells. The positive control is RNA extracted from a constitutively expressing Tomato strain (tomato/cre). Negative control is RNA extracted from the spleen of a LoxP-tdTomato animal (spleen loxP). Tomato expression is present only in Tomato+ sorted cells from primary tumors of selected transplanted mice (indicated with the bmt code). Samples were run in triplicates and normalized on β-actin mRNA. Data are represented as mean ±S.D. (d-f) Representative images of Tomato staining on FFPE sections of different tumors with the highest Tomato positive cell content (d and e: 10x, f: 20x, scale bars = 50 μm). In many cases the cells seem to be clustered, suggesting a clonal derivation from single fused cells.

